In contemporary America, professors openly say things like “All I want for Christmas is white genocide” or “OK, officially, I now hate white people,”. Teaching assistants claim that “some white people may need to die” so that Black people can get what they deserve. Editors at the New York Times assert that “White men are bullshit”, use the hashtag “CancelWhitePeople” and complain about “Dumbass fucking white people marking up the internet with their opinions like dogs pissing on fire hydrants” .
This is the same New York Times which published a piece entitled “Can my Children be Friends with White people?“, a question which the author answers largely in the negative: “As against our gauzy national hopes, I will teach my boys to have profound doubts that friendship with white people is possible. When they ask, I will teach my sons that their beautiful hue is a fault line. Spare me platitudes of how we are all the same on the inside. I first have to keep my boys safe, and so I will teach them before the world shows them this particular brand of rending, violent, often fatal betrayal.”
Sometimes, white people don’t like this sort of stuff. For instance, a few complained about the New York Times editor I mentioned, but writers for NBC News explained that “white people getting mad — or publicly performing anger, at least — about white people jokes is actually white people getting mad about threats to white power. Threats like a woman of color joining the editorial board of the New York Times after telling smarter and funnier jokes than them on Twitter. Racism is a mechanism of maintaining an imbalance of power — making it literally impossible, by definition, to be racist against white people, or to tell a racist joke about a white person”. Similarly, The Chicago Tribune has stated that “American racism is a uniquely white trait“.
USA Today has made this point too, that only white people can be racist. They’ve also noted that “A majority of white Americans believe discrimination exists against them in the United States” but have explained that this is not to be taken seriously, arguing that “America’s newest class of victims — i.e., white men — is on the warpath again. They complain that they can’t get into college because of affirmative action, can’t get a job because of diversity hiring, and can’t keep a job because of factories closing due to unfair trade deals. Now we can add to the “whine list” the fact that many white men feel they can no longer get ahead or get an advantage because of identity politics.”
CNN has published material explaining that white people who disagree with non-whites about racism are often engaging in “Whitesplaining”. This term was defined as follows: ““Whitesplaining” is an affliction that’s triggered when some white people hear a person of color complain about racism. They will immediately explain in a condescending tone why the person is wrong, “getting too emotional” or “seeing race in everything.”” The article went on to cite telltale signs of whitesplaining, such as when white people say things like “But I’m not a racist”.
Other times, white people agree with these narratives and devote themselves to fighting white supremacy. This can take an emotional toll on white people as a kind of racial self hatred. The New York Times has noted this in an advice column responding to a woman whose sense of white guilt caused them to have a mental breakdown. As they explain, white suffering is ultimately unimportant: “You have to relinquish your privilege. And part of learning how to do that is accepting that feelings of shame, anger and the sense that people are perceiving you in ways that you believe aren’t accurate or fair are part of the process that you and I and all white people must endure in order to dismantle a toxic system that has perpetuated white supremacy for centuries. That, in fact, those painful and uncomfortable feelings are not the problems to be solved or the wounds to be tended to. Racism is.”
NBC has also acknowledged the psychological toll of their ideology, telling white people that “you’re going to have to take a side. And yes, you have to do it now. It’s very likely, and understandable if you feel this is unfair, this is inconvenient, it’s frustrating, it’s difficult, it’s embarrassing, it’s going to alienate you from people you know, love, work with, watch the game with. That’s privilege. Someone once said, “when you’re accustomed to privilege, equality feels like oppression.” This is a taste of equality.”
And Forbes too has said that white people need to stop caring so much about their own suffering: “If you are not Black, your pain and hurt is not the priority right now. This may be an anomaly for you – it is not an anomaly for Black folks who live this life, everyday”.
In the political realm, Joe Biden has talked about how white people becoming a minority is not only not-bad, but in fact a positive good which will improve the country.
These news outlets, CNN, the NYT, USA Today, Forbes, and NBC, are not seen as organizations of the radical left. Like Joe Biden, they are seen as center left or moderate.
If we looked further to the left, we’d find things like Bernie Sanders saying “when you’re white … you don’t know what it’s like to be poor“, Buzz Feed running articles like “37 Things White People Need To Stop Ruining In 2018” (the first of which, apparently, is America), Vice positively covering vacations non-whites take just to get away from white people, and The Root publishing articles with titles like “White people are cowards” which conclude “I thought white people were evil. I was right.”
Mainstream right wing media does not have material like this about minorities. That is because the American right is, for the most part, not racist. The American left, however, is significantly based on anti-white sentiment and behavior.
The Anti-White Left
This statement is backed up by various studies which consistently show that liberals value white people less than non-white people. Most of this research also finds that conservatives exhibit no significant racial bias.
Liberals would support censoring research showing white genetic superiority with respect to intelligence more than they would support censoring evidence of black superiority.
Liberals and moderates view hiring discrimination as unfair when the victim is black but do not view it as unfair when the victim is white.
While not directly concerning how liberals view whites, it is also worth noting that Heiphetz et al. (2020) found that Americans dehumanize racists (or, “see them as less than human”) more than they do groups which are traditionally seen as being dehumanized.
Anti-White Isn’t Pro-Black
It’s worth noting that by accusing the left of being anti-white I am not accusing them of being genuinely pro-black. There is some reason to think that liberals, especially white ones, are often more concerned with being anti-white than they are with helping minorities.
For instance, Cooley et al. (2019). found that exposing people to left wing messages about white privilege caused their sympathy for poor whites to decrease while their sympathy for poor blacks remained the same.
Similarly, Dupree et al. (2019) found that: “Across five experiments (total N = 2,157), White participants responded to a Black or White interaction partner… liberals—but not conservatives—presented less competence to Black interaction partners than to White ones… This possibly unintentional but ultimately patronizing competence downshift suggests that well-intentioned liberal Whites may draw on low-status/competence stereotypes to affiliate with minorities”. In other words, white liberals talk to black people like they’re children.
This may also explain why it is that leftists spend a great deal more time talking about white on black murder than they do on black on black murder even though the later is far more common.
On White Guilt and Racial Identity
Some people have trouble accepting that the left is anti-white because so many white people are leftists. This should not be that confusing. We all know that people can internalize the narratives that justify discrimination against them. Leftists talk about this happening to racial minorities and women. There is no reason why this could not also happen to whites.
We also know that people can have a bias against themselves at the individual level. We normally call this low self-esteem and we know that liberals, on average, have lower self esteem than conservatives (Schlenker et al., 2012). Research has even suggested that people’s political opinions shift to the right if you boost their self esteem prior to having them take a political quiz (Belmi and Neal, 2014). Since we know that leftism has something to do with disliking yourself as an individual, it should be even less surprising that white liberals exhibit a dislike of their own ethnic group which is not typical of the members of any other group.
Intuitively, we might suspect that this kind of thing, what is often called “white guilt”, may be psychologically damaging. This intuition is supported by Fujushiro (2009) who found that thinking your race is given an unfair advantage doubled a person’s risk of poor mental health even after controlling for age, sex, education, income, and marital status.
There’s also research showing that white guilt has increased with time, and that leftist ideology has a causal impact on white guilt.
So far as I can tell, research estimating the average degree of racial guilt among white college kids began in the 1970s (Bardis, 1973). Guilt was measured with questions like “Do you feel personally guilty about the American Negro’s present social inequality?”.
Back then, on a 5-point scale ranging from completely disagree to completely agree, whites averaged a score of less than 2 on most questions.
So far as I know, another paper quantifying white guilt wasn’t published until 1999 (Swim and Miller., 1999). Agreement with the same sorts of statements as before was rated on a 5 point scale, and the average response was 2.12, implying only slight guilt and that the mean level of guilt had not changed much since the 1970s. However, this slight guilt was pervasive with only 6% of the sample saying that they strongly disagreed with all five statements of guilt.
In 2007, this same scale was administered to another sample of white college kids (Case, 2007). This time, the mean response was 3.64. After these students took a diversity course, the mean score increased to 3.94, implying a good deal of guilt, and implying that leftism causes such guilt.
Similarly, Powell et al. (2005) reported the following: “In Experiment 1 (N = 110), White American participants assessed 24 statements about racial inequality framed as either White privileges or Black disadvantages. In Experiment 2 (N = 122), White participants generated examples of White privileges or Black disadvantages. In both experiments, a White privilege framing resulted in greater collective guilt”.
Thus, over time white guilt is becoming more common and such guilt is caused by leftist rhetoric. We we’ve seen, this is potentially damaging to the mental health of the white people who internalize left wing narratives.
Such narratives are probably not only damaging to those who feel an active sense of white guilt. It is likely that they’ve also harmed white people who have responded to the modern political climate by simply de-identifying with their race or ethnic group. We have some reason to think that this is damaging, because, as can be seen below, identifying with one’s race is generally correlated with higher self-esteem and this is especially true of white people.
On a measure of ethnic identity, African Americans scored the highest followed by Hispanic Americans who scored higher than white Americans.
White Americans failing to identify with their ethnic group despite the positive impact this may have on self-esteem may in turn partly explain why it is that, ever since the 1970’s, black Americans have scored higher than white Americans on measures of self-esteem (Twenge et al., 2002).
Thus, the anti-white bias of liberals and lack of ethnic identity on the part of white Americans is plausibly damaging their mental health.
White Americans Aren’t Racist
In this section I’ll argue that, generally speaking, white Americans are not racially biased while Americans of every other race generally are.
The most straightforward evidence of this comes from surveys that simply ask Americans to rate how they feel about each major racial group. White people rate all groups roughly the same while each other race rates their own group as the most favored. In the case of hispanics and blacks, white people are consistently rated more lowly than any other racial group. (Zigerell, 2021;Pew, 2019)
We might think that white people are lying and that they are more biased than these results would indicate. Another line of evidence less susceptible to lying involves experiments in which two groups of people are asked how they deal with various situations. For both groups the situations will be identical except for the race of someone involved. We can thus experimentally test people degree of racial bias. Doing so we we find that white american’s don’t exhibit a significant degree of racial bias while black Americans do (Zigerell, 2018).
This data suggests that on average white people exhibit no racial bias. Of course, this does not mean that there are no racist white people. But the impact of such people is made up for by an equal effect from white people who are biased in favor of non-whites so that the net mean level of discrimination is zero.
Sometimes, white Americans are accused of racism for believing in stereotypes. In response to this it is useful to point out two things. First, fewer than one third of white Americans report thinking that black people are, for instance, less intelligent or hardworking than white people (Moberg et al., 2019).
Secondly, whether a stereotype is an example of unfair racial bias depends on whether it is true. In this very section I am arguing that thinking white people are racist is unfair and biased specifically because it is not true. By contrast, the negative stereotypes white people are accused of believing in with respect to black people are overwhelmingly supported by empirical evidence.
First, take intelligence. Meta-analyses of data on millions of participants show that black people score lower than white people do on intelligence tests (Roth et al., 2001).
And contrary to popular belief, most experts agree that such tests are not racially biased because they pass formal statistical tests for test bias (Reeve et al., 2008).
Black Americans also score lower than white Americans on measures of emotional intelligence. In fact, on objective measures of emotional intelligence the black-white gap is roughly as large as the black-white gap in IQ (Joseph et al., 2010). Black people do score higher on self report measures of emotional intelligence, but this seems to be due to the already noted tendency of black people to think relatively highly of themselves rather than their actual degree of emotional intelligence.
Black Americans also score lower than white Americans on measures of practical intelligence having to do with how to deal with real world situations (Whetzel et al., 2008).
Given this, it seems obvious that someone could conclude that black people are, on average, less intelligent than white people without harboring any sort of race based hatred or bias. The same case could be made for hard work. Consider three facts:
First, black Americans are less likely than white Americans to have a job (Kiersz, 2015).
Second, while at work black Americans spend more time than white Americans not working (Hamermest et al., 2017).
Third, as children black Americans spend less time than white Americans doing homework (NCES, 2011)
Thus, a simple look at the evidence seems to verify the idea that black people are, on average, less hardworking.
Connecting violence to black people is also sometimes called an unfair stereotype but it is well known, and documented later in this article, black people are way more likely than others to commit violent crime. Other sections of this article also document that black people spend more on luxury goods than do white people, save less after controlling for income, and generally have a higher view of themselves.
Stating these things may come off as racist, but it should be considered no more racist than accusing white people of racism is. More importantly, these statements are true. The fact that most white people today do not believe these stereotypes, or at least pretend not to, speaks to them conforming to an ideology which is biased in favor of non-white people.
Sometimes it is argued that we can show most white Americans are racially biased by appealing to the results of implicit association tests which are supposed to measure subconscious biases which people may be totally unaware of. However, IAT scores don’t predict actual racist behavior and so are not a valid measure of racial bias (Carlsson et al., 2016).
In conclusion, using valid measures of racial bias reveals that minorities and liberal whites are racially biased either in favor of minorities or at least against white people. By contrast, the average white person exhibits no significant racial bias.
Racial Bias in the Modern Economy
Notably, academics and journalists are overwhelmingly liberal (Rothman 2005; Langbert 2018; Pew, 2006; Weaver et al., 2019). That academics and journalists subscribe to an ideology which predicts anti-white bias is significant since these same academics and journalists are the ones who have convinced so many people that racism on the part of white people is the primary explanation of racial inequality in the United States.
This idea is supported by many people in part because they feel that any other sort of explanation is inevitably racist. The implicit logic here, that it is morally problematic to accuse a non-white group of behavior which explains their life outcomes but it is not morally problematic to blame inequality on the racist behavior of white people, is itself obviously bigoted and anti-white.
In the sections that follow, I will deal with various lines of evidence suggesting that modern racial bias is impacts black people’s incomes, unemployment rates, educational opportunity, and ability to get a loan. In later sections I deal with racial bias and crime and the relationship between current inequality and racial bias in history.
Differences in Income
Some think racism is necessary to explain group differences in income. But blacks actually make as much or more money than whites when education, cognitive skill, marital status and other confounding variables are controlled for. Such has been shown multiple times.
Similarly, it has been shown that people are willing to pay 3.5% more for a book when they are led to think that books author is black suggesting that when comparing authors of equal talent black authors likely have a higher income (Weinberg et al., 2022).
Of course, racism may explain a group difference in one of these confounding variables, such as educational attainment, but it is important to note that group differences in income disappear or flip direction without directly controlling for any measure of racism.
Differences in Educational Opportunity
With respect to educational opportunity, Murray and Rueben (2008) calculated spending per pupil for US schools between the years 1972 and 2002. They found the following: “In 1972, the ratio of nonwhite to white spending was .98; this trend had reversed by 1982, as spending per pupil for nonwhite students was slightly higher than for white students in most states and in the United States as a whole and has been for the past 20 years”. Thus, since 1982, spending on non-white students has been greater than spending on white students.
This issue was revisited by Richwine (2011) who found that spending on black students was 1% greater than spending on white students, while spending on Asian and Hispanic students was a few percentage points lower.
These difference in spending are reflected in school characteristics: on average, blacker schools have smaller classes more experienced teachers who have more formal education and who receive more pay (Cocoran et al., 2003).
This information may surprise some people as leftists often cite data showing that blacker school districts receive less funding than average. This is true but within school districts blacker schools receive more money and thus black students go to better funded schools than white students despite the headlines people sometimes see concerning district level disparities (Ejdemyr et al., 2017).
Once high-school is complete, students apply to college. Based on aggregated data from 20 previous studies, we can estimate that when comparing people of equal qualifications, Black applicants are roughly 21 times more likely than white applicants to be admitted, while Hispanics are 3 times as likely, and Asians are 6% less likely or 59% more likely depending on whether we use the mean or median estimate.
(The race columns show the odds of admission compared to those of white applicants when qualifications are held constant.)
Similarly, it’s been estimated that the proportion of students attending selective colleges who are white would increase from 66% to 75% if admissions were based solely on test scores.
And once in college non-white students are more likely to receive grants and scholarships despite the fact that white students are no more likely to have their parents pay for their school (Kantrowitz, 2011; Brown, 2019)
As a whole then, resource allocation within the education system favors non-whites students over white ones. Obviously then, white racists have not inhibited black economic success by depriving them of the resources needed for educational success.
Difference in Unemployment
Previously, I noted that racial income differences can easily be flipped by controlling for obvious determinants of income. Of course, to have an income at all you first have to be employed and many people think companies avoid hiring minorities for racist reasons.
This suggestion is difficult to reconcile with the overt behavior of corporations. For instance, a 2017 report on all the companies in the S&P 100 found over 90% of them had engaged in diversity initiatives and 75% of them had gone as far as setting specific hiring targets for minority employment. The same report found that such practices are rapidly gaining in popularity.
In fact, since the early 1990s it has been true that most US firms with 100 or more employees have some sort of affirmative action policy (Dobbin et al. 2006).
The idea that racism explains group differences in employment levels is also hard to square with the fact that there was no unemployment gap between races in the early 20th century when white people were far more likely to be racially biased against black people.
It’s worth noting that the unemployment gap between races that emerged in the second half of the 20th century seems to be, at least in part, voluntary. As Williams (2011) reports: “During 1979-1980, the National Bureau of Economic Research conducted a survey in the ghettos of Boston, Philadelphia, and Chicago. Only a minority of the respondents were employed, yet almost as many said it was easy or fairly easy to get a job as a laborer as said it was difficult or impossible; and 71 percent said it was fairly easy to get a minimum-wage job.”
If you tell this to a leftist, they are likely to respond by noting that black people are less likely than white people to get called back when they submit a job application that is identical in every way other than the race implied by their name. To be specific, Quillian et al. (2017) meta-analyzed the research on hiring discrimination and found that black applicants received 36% fewer call backs than white applicants. So this effect isn’t very large even if it is explained by racism.
But it’s probably not. These sorts of experiments rely on a basic misunderstanding of how qualifications relate to job performance. Suppose that the distributions of job performance among blacks and whites consist of two overlapping normal distributions, like this:
Now suppose that qualifications on a resume require a certain level of skill and ability to obtain such that those who would be bad employees cannot easily acquire them. As is hopefully evident in the below example, there is no possible threshold for job performance, or any other relevant trait (e.g. job related knowledge, cognitive ability, self discipline, etc.,) where the white mean is above the black mean in general, but not still above the black mean among those who exceed that threshold.
This becomes even more true if we make it easier for black people to acquire a given qualification than it is for a white person. In this scenario, among applicants with any such qualifications, white job performance will exceed black people’s job performance among those with equal qualification even if there is no mean difference in job performance between black and white people in the total population.This situation is exactly what happens when a society institutes affirmative action and as we’ve seen affirmative action for African Americans is widespread in contemporary America.
These theoretical considerations should be sufficient to show that these experiments are invalid measures of racism, but if you’d like empirical evidence to substantiate this consider the results of a massive study carried out by the federal government to measure people’s work-related cognitive abilities in terms of things like everyday math skills, writing skills, and the ability to efficiently use information taken from a document.
As can be seen, the general trend was such that black respondents were outscored by white respondents who had lower levels of education attainment than the black respondents did.
Similar results are found in Neill (1990), a paper which shows the mean AFQT percentile scores of black and white men aged 19-21 by education level for the years 1953-1958 and 1980. (The AFQT is a test designed by the military to measure cognitive skills relevant to job performance such as reasoning ability, mathematical ability, and reading ability.)
In 1980, Black people who had completed 3-4 years of college came in, on average, at the 49.7th percentile, or slightly below the average score unconditional on education. By contrast, the average percentile scores were 80.2 for whites with 3-4 years of college, 65.8 for whites with 1-2 years of college, and 46.5 for whites with 3-4 years of high school. This was even more extreme in the 50s, when black people with 3-4 years of college completed scored lower than whites with 3-4 years of high school.
Similar disparities are seen within occupations, with white people significantly out scoring black and Hispanic people on IQ tests when comparing people within the same industries (Murray, 2021).
Thus, it is clearly rational for employers to prefer the average white applicant over the average black applicant even if they are the same on paper in terms of things like work experience and educational attainment.
Ideally, we’d want to test this by comparing the rate at which black and white applicants are hired after controlling for the qualifications that show up on a resume as well as direct measures of the job performance related abilities that are not directly captured on a resume. To my knowledge, the only paper to do this is Ho (2005) who found that race did not predict whether an applicant was hired once such variables were controlled for.
The most important evidence on this question comes from Roth et al. (2003) who meta-analyzed data from 19 previous studies and found that black employees scored 0.30 standard deviations lower than white employees on measures of job performance even when they were working the same job at the same organization. This suggests that what is being required of applicants in terms of actual job performance, rather than on paper qualifications, is lesser for minorities.
This is consistent with most firms engaging in affirmative action in hiring and, because they are invalid measures of racial bias, this is also consistent with black applicants receiving 36% fewer call backs on applications.
Some might argue that this explanation is rude, racist even, because it requires that we note the job performance gap between black and white people. Here I would re-iterate that it is no less rude or racist to blame this difference on the supposed immoral behavior of white people. The only reason I’ve even brought this up is to defend white people against this charge. We can also note that, obviously, a group difference in averages is just that, a difference in averages, and there are individuals of all types in every racial group.
Differences in Loan Acceptance Rates
Another common argument made by the left concerns the fact that black people have a harder time than white people getting a loan. Data from Pew shows that black people are indeed more likely to be denied for a mortgage loan, but even among blacks the rate of denial is only 27%.
Turning the interest rates, it is true that Black people are more than twice as likely as whites to get a mortgage interest rate of 8% or more. But this is very rare even among black mortgage holders. The average interest rate seems to be similar among whites, Hispanics, and blacks, though possibly significantly lower for Asians.
So these differences are real but fairly small. Leftists are apt to point out that some of these differences exist even after controlling for credit scores. This is true, but the remaining differences are really quite small. For instance, Cheng et al. (2014) analyzed data from the U.S. Survey of Consumer Finances for the years 2001, 2004, and 2006 and found that controlling for measures of consumer behavior and debt risk reduced the black-white average interest rate gap to 0.29%
More importantly, credit scores don’t predict behavior equally well across races. Consider the following from a report given to congress by the federal reserve on how well loan performance is predicted by credit scores: “Consistently, across all three credit scores and all five performance measures, blacks… show consistently higher incidences of bad performance than would be predicted by the credit scores (p.89)”. In other words, loans to black people have a higher risk of default even after controlling for credit score.
This report also notes that this is largely just true of black and white people with poor credit scores. Among those with high credit scores, there isn’t much of a difference across race in risk. Relatedly, a study by the Chicago federal reserve found no racial bias in loan approval rates among those with a good credit score but a significant bias in favor of whites among those with a bad credit score.
The strongest evidence against racial bias in lending comes from Bhutta and Hizmo (2019). They analyzed a data set consisting of all FHA-insured mortgages that originated in 2014 and 2015. After controlling for lender effects, credit score, and income, they found a black-white interest gap of 0.03% and a Hispanic-white gap of .015%. Moreover, it was found that minorities had on average paid for fewer discount points than whites. Correcting for this, it was shown that people of each race face the same price schedule.
Thus, there appears to be no racial bias in the willingness of banks to give people loans.
White Women and Affirmative Actions
When white people voice opposition to affirmative action, it is sometimes claimed that this is hypocritical or problematic because white women have benefited more than any other group from affirmative action. Generally, this claim is made in popular press on the basis of no serious evidence.
For instance, Moore (2022), writing in “Teen Vogue” claimed that “it comes as a surprise to many to discover that white women have benefited more from affirmative action programs and policies than any other demographic.”. Her evidence for this is the fact that Crenshaw (2007) said “the primary beneficiaries of affirmative action have been Euro-American women.”. Crenshaw provided no empirical evidence for this statement.
Similarly, Massie (2016), writing for Vox, stated that: “”The primary beneficiaries of affirmative action have been Euro-American women,” wrote Columbia University law professor Kimberlé Crenshaw for the University of Michigan Law Review in 2006. A 1995 report by the California Senate Government Organization Committee found that white women held a majority of managerial jobs (57,250) compared with African Americans (10,500), Latinos (19,000), and Asian Americans (24,600) after the first two decades of affirmative action in the private sector.”
This is the same Crenshaw citation as above. As for the California Senate report, it of course does not follow that just because white women have had more managerial jobs since affirmative action began that affirmative action, as opposed to more white women trying to enter the work force, or more white women going to college, etc., caused all those occupational gains.
Kohn (2013), writing in Time, argued that “While people of color, individually and as groups, have been helped by affirmative action in the subsequent years, data and studies suggest women — white women in particular — have benefited disproportionately. According to one study, in 1995, 6 million women, the majority of whom were white, had jobs they wouldn’t have otherwise held but for affirmative action.”
Of course, since white women are the majority of women this does not show that minority women did not benefit more than white women from affirmative action. Further, the article they cite as the source for this figure is another article by Tim Wise which states that “According to a 1995 study, there are at least six million women — the overwhelming majority of them white — who simply wouldn’t have the jobs they have today, but for the inroads made by affirmative action (Cose 1997, 171).”
The book by Cose in turn states, on page 171, that “The Working Woman special report on affirmative action also cited a N95 study by Alfred Blumrosen, a professor at Rutgers University Law School and consultant to the Labor Department, suggesting that an “estimated six million women wouldn’t have the jobs they have today were it not for the inroads made by affirmative action.”
Notice that this says nothing about the racial composition of the women who got jobs thanks to affirmative action. Wise was thus lying about his source, which itself is only citing another report which supposedly cites the primary source.
Turning to the primary source, on page 118, Blumrosen (1995) states that “It is modest to point out that 5 and one half million minority employees are in higher level jobs than they would have been under the occupational distribution of 1960, and that 6 million women have moved into executive, managerial, professional and sales jobs since 1972”. This paper makes no note of proportion of jobs that went to white women nor does it show that this change in occupational distribution was entirely due to affirmative action.
Moreover, this comparison fails to account for the population sizes of these groups. Using census demographic data from 1980, roughly the mean year of the time period under consideration, giving 6 million jobs to white women would mean that one in every 17 white women got a job via affirmative action and giving 5.5 million jobs to non-whites would mean that one in every five non-whites were given a job via affirmative action. Thus, even if we assume that these numbers are a valid measure of jobs gained due to affirmative action, which has not been shown to be true, and that literally all the women given such jobs were white, which has also not been demonstrated, it is still misleading to claim that white women benefited the most from affirmative action.
Turning away from the reasons given in popular discourse to serious attempts to measure the impact of affirmative action, the best methodology available is to compare the rate of at which various groups employment grew among firms doing federal contract work, and who are mandated to follow an affirmative action policy, to the rate at which their employment grew among non-contracted firms. Using this approach on data covering 1970 – 1980, Smith et al. (1984) found that affirmative action had a small positive effect on employment for white women but a much larger positive effect for blacks of both sexes. The most dramatic benefit was for black men who in 1980 accounted for 11.6% of managers and officials in non-contractor firms but 44% of them in firms with federal contracts.
Covering a larger time period, Kurtulus (2016) analyzed data from 1973 to 2013 and found that white women were the primary victims of affirmative action in federal contract work writing that “affirmative action increased the employment of black and Native American women and men at the expense of white women”. The paper also notes a trend for white men to become the managers of federal contract work, but obviously the explanation for this is some factor other than attempts to fill federal affirmative action requirements. Thus, this approach to measuring the impact of affirmative action produces findings which totally contradict the narrative that white women were the primary beneficiaries of affirmative action.
A somewhat less rigorous approach is to survey private firms, regardless of contractor status, and see whether firms claiming to support affirmative action predicts who they employ. This method warrants less confidence than the previous method because we may doubt the validity of firm’s self reporting who they employ and whether they utilize affirmative action.
The results of these studies vary. Holzer et al. (1999) found that “Affirmative Action is associated with increases of about 15% in the probabilities of hiring white women and black men. On the other hand, the last row indicates that the probability that a white male is hired is lower by about 20% under Affirmative Action.”. So white women in this paper tied with black men for the group that benefited the most and the negative effect on white men was large enough such that the net effect on whites was still negative.
Button (2006) took this same approach and found that support for affirmative action was unrelated to the hiring of white women.
By contrast, the same authors found that support for affirmative action did positively predict the hiring of black employees (Button et al., 2003).
Kalev et al. (2006) produce still different results. This paper begins by documenting the rise in various forms of affirmative action in private firms between 1970 and 2002.
They then go on to show that which group benefits most from an affirmative action depends on which policy you look at. The most consistent pattern across policies is the negative impact on white men.
That said, in this data set white women are evidenced to have significantly benefited from affirmative action. However, this data is restricted to the impact affirmative action has on who is hired as a manager and is based on relatively older data. This makes it not comparable to the studies referenced above on the net impact of affirmative action on who is hired across all employee positions. And as already noted the federal contract data also showed a lesser anti-white impact in the case of managers. So this study does not contradict the other reviewed research to the degree that it might initially seem to.
In total, this line of research also fails to support the contention that white women have benefited most from affirmative action. And as we’ve already seen, the most solid data available actually suggests white women have on net been hurt by affirmative action.
Moving away from the economy, in studies on admissions bias they generally don’t break the data down by sex and race. However, as we’ve already seen the net effect is massively negative for whites so if there is any benefit to be a white women, which there is no reason to think is true to begin with, then it is more than made up for by the negative impact on white men.
For these reasons, the relationship between white women and affirmative action does not contradict the general anti-white bias that is present in our society.
On Racial Diversity
Sometimes affirmative action is justified on the grounds that racial diversity is intrinsically beneficial. In the context of the economy this line of justification claims that minorities make firms more innovative. This is false. In fact, racial diversity is negatively related to innovation and overall level of performance (Bell et al., 2010).
At the economy-wide level, Alesina et al. (2004) found that ethnic diversity negatively correlates with economic success such that going from perfect homogeneity to maximal diversity predicts a 2% decline in the annual national growth rate of GDP per capita. Even comparing nations that start with the same level of economic development, the nation with greater ethnic diversity will have a lesser rate of economic growth going forward (Posner, 2004).
In the context of education people say that experiencing a diverse student body is beneficial for everyone. In reality, school diversity predicts negative outcomes with respect to student-rated school satisfaction, Consider the evidence from Rothman, Lipset, and Nevitte (2003). This paper analyzed the relationship between racial diversity and the experiences people had at school in a sample drawn from 140 American universities (N = 4,083 individuals, 1,643 students, 1632 faculty members, 808 administrators). They found the following:
“As the proportion of black students rose, student satisfaction with their university experience dropped, as did their assessments of the quality of their education and the work ethic of their peers. In addition, the higher the enrollment diversity, the more likely students were to say that they personally experienced discrimination… Faculty members also rated students as less hard-working as diversity increased…
Enrollment diversity was positively related to students’ experience of unfair treatment, even after the effects of all other variables were controlled. (As the proportion of black students grew, the incidence of these personal grievances increased among whites. Among blacks, however, there was no significant correlation. Thus diversity appears to increase complaints of unfair treatment among white students without reducing them among black students.)”.
These perceptions of discrimination were not shared by the non-student sample. The authors write:
“Among faculty and administrators, higher minority enrollment was significantly associated with perceptions of less campus discrimination and, among administrators, more positive treatment of minority students. But these findings were offset by the absence of similar results among students, who reported more personal victimization as diversity increased.”
All these results continued to be true after controlling for various measures of socio-economic status.
Owen et al. (2015) also found that “Students at more racially diverse institutions are less happy. They report lower levels of positive emotional well-being and higher levels of negative emotional well-being and of negative life evaluation”. They report that diversity is a similarly negative experience for each racial group.
Setting how students feel about their school aside, Bohrnstedt (2015) finds that both black and white students score worse on standardized tests the greater the proportion of their school that is black.
Turning to bullying, Farris (2006) finds that black students are more likely to be bullies than are Whites students while white students are more likely than black students to be the victims of bullying. Latino students are both more likely than black students to be engage in, and be a victim of, bullying. Farris also finds that racial differences in family SES, neighborhood SES, attachment to friends, parents, and school, and physical development, don’t explain racial differences in bullying.
With respect to interracial bullying, Farris finds that black on white bullying is 64% more common than is White on Black bullying.
In part, these differences probably arise because bullying is socially rewarded in non-white student subcultures. After controlling for gender, age, academic performance, family structure, parental educational attainment, and extracurricular activities, Farris finds that the more non-white students bully others, the more popular they are among their peers. This effect does not exist among white students.
Perhaps most dramatically, Farris finds the following: “Regardless of race, attending a high-minority school increases risk of suicide significantly: for every one percentage point increase in the percent minority in the school, the likelihood of suicide increases by one percent.”
Sticking with suicide but moving to adult populations, Becares et al. (2018) conducted a meta-analysis and found that a 10% increase in the local representation of one’s own ethnic group predicts an 12% decrease in the odds of a person being suicidal. Similarly, Putnam (2007) found that people who lived in more diverse cities reported being less happy, having fewer friends, and trusting others less. It’s also worth noting that the negative effect of diversity on social capital persists after controlling for socio-economic status (Denisen et al, 2020; Putnam, 2007).
Other research finds that people are happier when they represent the majority of the local population, that being a member of the dominant racial group of a church congregation predicts a greater sense of belonging in the church, having more friends in the church, and participating in more church activities, and that people rate their customer service experiences better when dealing with co-ethnics (Kanazawa et al., 2015; Martinez et al., 2013; Montoya et al., 2013).
At the national level, ethnic diversity is also correlated with higher crime rates (Marier et al., 2020). At the level of US counties, it’s also been shown that the more black or hispanic people live in a county the higher that counties property and violent crime rate tends to be and this remains true after controlling for poverty, region, population density, age, unemployment, education, and divorce rates (Kposowa et al., 1995). In fact, the percent of the population that is black is a better predictor of violent crime than is any of the other variables I’ve just listed.
A final myth about diversity to dispel is the idea, called “contact theory” that if you get people of different races to interact with each other they will become less racially biased. There is research indicating this is true, once you correct for publication bias you find that there is actually a modest (ns) tendency for racial bias to increase in response to cross-racial contact (Paluck et al., 2019).
Conclusions on the Economy
In sum, ethnic diversity harms communities and so, like the lies about white women and affirmative action, diversity cannot justify the anti-white bias present in our institutions. As we’ve seen, white people are disadvantaged in terms of school funding and admissions, income, and hiring with respect to expected job performance. Given this, it seems fair to claim that the economy as a whole is anti-white and that white privilege in the context of the economy is a myth.
Racial Bias in Criminal Justice
Turning now to the criminal justice system, in this section I will argue that there is either no racial bias, or a pro-black bias, in the rate at which Americans are stopped, searched, shot, and arrested by police, as well as the rate at which they are incarcerated, given a long sentence, or sentenced to death by a judge.
Police Stop Rates
Beginning with stop rates, a useful first observation is that black and white Americans report experiencing the same rate of police initiated contact while hispanics report a lower rate (Whyde et al. 2018). This is not what we would expect if police were going out of there way to stop minorities.
Second, Alpert et al. (2007) finds that white (and Hispanic) police officers are less likely than black police officers to pull over a black citizen. Given that black people generally exhibit a pro-ingroup bias, if racial bias were driving stop rates you’d expect black officers to stop fewer black citizens.
Smith et al. (2001) made the same fining.
Another line of evidence comes from Lange et al. (2005). This paper used cameras to directly measure racial differences in speeding and found that “the proportion of speeding drivers who were identified as Black mirrored the proportion of Black drivers stopped by police”.
It is also worth mentioning the role that matching the description of a criminal suspect plays in police stops. As already noted, the high rate at which black people are arrested corresponds to the rate at which criminal offenders are described as black in police incident reports. With respect to police stops, as documented by Greenwald (2001) black people make up a greater proportion of police suspects than they do people who are stopped.
The next study to examine is Alpert et al. (2006). In this study citizen observers accompanied police and recorded the exact reasons for suspicions which lead to a person being stopped. Doing so they concluded “officers were equally likely to stop individuals whether they were male or female, African-American or white, low or high socioeconomic status.” and there data does indeed show that race was unrelated to the probability of being stopped.
Importantly, black people made up 71% of those stopped by police so there is reason to think that the police did not avoid pulling black people over just because they were being observed.
The paper also documented that black people were more than 4 times as likely as white people to have suspicions formed against them by police for reasons unrelated to any directly visible illegal behavior.
This was especially true when the police officer forming the relevant suspicion was black, suggesting this tendency was not due to racial bias.
The paper goes on to detail several examples in which a very high level of “non-behavioral” suspicion was formed by police officers: “in one case the officer formed suspicion because the suspect was driving a motor vehicle that fit the description of a “G-ride” – heavily tinted windows, custom rims, and a flashy paint job. Four out of these thirteen cases involved vehicles that matched a BOLO (be on the lookout) call. One case involved a suspect who was in the vicinity of a robbery and shooting that had occurred recently. Two cases involved suspects who appeared to act nervous when officers pulled next to their cars. Another case involved a woman hiding in the “shadows of a known prostitution area.” The narrative descriptions of cases indicate that the probability of non-behavioral suspicion was greatly influenced by officers having pre-existing information on suspects or events where civilians were in areas of known criminal activity, or where civilians acted nervous when the police approached.”
Given that these reasons tend to depend on the ability to clearly see what is happening, it is unsurprising that police form most of their suspicions, and carry out most of their stops, during the day time when the sun is out.
I’ve emphasized that black people are more often than white people pulled over for being suspicious in ways that are easier to see during daylight as a way of preemptively critiquing a method for detecting racial bias called the “Veil of Darkness” test. This test is based on the idea that more black people being pulled over in the daylight than while it is dark is evidence that during the daylight officers are noticing that drivers are black and pulling them over for this reason. As we’ve already seen, the literature on police stops provides good reason to think that black people will be pulled over more during the day even in the absence of any racial bias. For this reason, the Veil of Darkness is not a proper test of discrimination.
Moreover, it isn’t actually clear that black people are pulled over more during the day. The first paper to use this test actually found that black people were pulled over more at night in Oakland, Ca (Grogger et al., 2006). Other research found that there was no difference in the rate black people were pulled over during day and night in Syracuse, NY and Cincinnati, OH (Worden et al., 2012; Ridgeway, 2009). But other people found that black people were pulled over more during the day and the weight of evidence temporarily shifted when Pierson et al. (2020) found black people were pulled over 3% more during the day than at night in a sample of tens of millions of stops from a variety of states (headlines often reported the sample size as 100 million but this is seemingly the sample they had for other analyses in the paper, the veil of darkness test was limited to data from 120 days and certain hours of the day/night and so is presumably just a fraction of the often cited 100 million figure). But then Stelter et al. (2022) found that blacks are pulled over more during the night in a sample of 18 million stops. It is now clear that whether black people are stopped more during the day, the night, or equally in both, depends on where in America you look. There is no way to be confident about what the national average is, but as noted this isn’t a proper test of discrimination in any case and so this lack of confidence should not trouble us.
The last issue concerning stop rates to talk about is stop and frisk. This policy was carried out in New York City and so cannot be taken as strong evidence of any national bias in stop rates. That being said, the policy did not lead to bias in NYC either. The largest analysis done on this policy found that black people were stopped more often than white people but that stopped black and white people were equally likely to be found doing something deserving of arrest indicating that police were just reacting rationally to the higher crime rates of black people (Coviello et al., 2015).
To sum up this section, the lack of racial bias in arrest data gives us a strong reason to think that stop rates are not biased. This notion is further supported by evidence from research using cameras to measure student behavior, by research that sent citizens to ride along with police and document the reasons for police stops, and by research on the rate at which black police officers stop black citizens. It isn’t clear whether black people are pulled over more during the day or night but in either case this would not be solid grounds upon which to conclude discrimination is taking place. And so the weight of the evidence favors the view that police stop rates are not racially biased.
Search Rates
The next legal outcome I’m going to talk about is search rates. The most obvious way to test search rates for bias would be to see if black people are more likely to be searched than white people after controlling for things like offense seriousness, resisting arrest, etc. Bolger et al. (2018) meta-analyzed such research and found that race significantly predicted being searched but only in studies done prior to the year 2010. In more recent research the effect size was far smaller and statistically insignificant. Thus, at least for the current time period this sort of research is evidence against significant racial bias in search rates.
Alpert et al. (2007) finds that white (and Hispanic) police officers are more likely than black police officers to search a black citizen. But same study found white officers were less likely to pull black people over to begin with, so this evidence merely suggests that white officers are being more accurate in who they pull over.
Smith et al. (2001), on the other hand, find that officer race is unrelated to the probability of a black citizen being searched.
Similarly, Baumgartner et al. (2018) finds that, if anything, the gap in search rates between blacks and whites is greatest among those pulled over by black police officers.
A common argument used to show that search rates are racially biased goes like this: among those the police pull over or search, whites are more likely than nonwhites to be found guilty of a crime meaning the amount of evidence for criminality police require before they will pull over or search white people is higher than the bar of evidence they use for nonwhites. After all, if , for instance, police searched everyone of both races with a 50% or higher chance being a criminal then the arrest rate among people who have been searched would be the same for each group. The fact that more whites are arrested than blacks among those searched could only happen if, for instance, whites had to have a 60% chance of being a criminal before being searched whereas nonwhites were searched if they had a 40% chance or higher of being a criminal.
Empirically, the largest national dataset available indicates that the hit rate for police stops is 2 percentage points higher for blacks (32%) than it is for whites (34%), so there is a difference but it is quite slight (Ekstrom et al, 2022).
However, inferring any discrimination on this basis is not valid reasoning. Though this argument was popular in left wing circles for many years, it is now recognized by mainstream academics as statistically unsound. For instance, Pierson et al. (2020) write: “suppose that there are two, easily distinguishable, types of white driver: those who have a 5% chance of carrying contraband and those who have a 75% chance of carrying contraband. Likewise assume that black drivers have either a 5 or 50% chance of carrying contraband. If officers search drivers who are at least 10% likely to be carrying contraband, then searches of white drivers will be successful 75% of the time whereas searches of black drivers will be successful only 50% of the time. Thus, although the search criterion is applied in a race-neutral manner, the hit rate for black drivers is lower than that for white drivers and the outcome test would (incorrectly) conclude that searches are biased against black drivers”
To take a more concrete example, imagine you have ten white kids in one room and ten black kids in another and you know that one person in each room has an illegal substance on them. If each kid within each room has the same chance of being a criminal then each has a 10% chance and so a rule, for instance, of searching people who have a 15% or higher chance of being a criminal will lead to no searches. But of course police operate on the basis of the fact that everyone is not equally likely to be a criminal. Suppose you have reason to think that people who dress in certain ways have an elevated risk of criminality such that anyone in either of these rooms who dresses that way has a greater than 15% chance of being a criminal. Finally, imagine that two white kids and three black kids dress this way, you search all five, find the illegal substance in both rooms, and so have a hit rate of 50% for whites and 33% for blacks despite searching everyone in both rooms using the same 15%+ bar of evidence.
The way that the chance of being a criminal is divided up among people within a group is called their distribution of criminal risk and the hit rate test assumes that this distribution is identical across groups. Given the slight difference in hit rate by groups, even a slight deviation from this assumption could explain the racial difference in hit rates. But there is no reason to think groups would have identical risk distributions and in fact it would be a coincidence of miraculous proportions if they did so the hit rate test cannot be used to infer that police use a lower bar of evidence for searching black people.
There is a method called a threshold test which researchers have used to directly estimate, by race, the minimum probability of criminality that police require someone to meet prior to searching them. Such research has estimated this minimum threshold to be 23% in the case of whites and 21% in the case of blacks, indicating the possibility of a slight racial bias in search rates (Ekstrom et al, 2022). However, as noted in the paper that developed this method: “if officers disproportionately suspect more serious criminal activity when searching black and Hispanic drivers compared to white drivers (for example, possession of larger quantities of contraband), then lower observed thresholds may stem from non-discriminatory police practices” (Pierson et al, 2020). Empirically, it is true that the offenses of black criminals are on average more serious than the offenses of white criminals (Everett et al., 2003). Given this, the threshold test cannot differentiate between police engaging in racial bias and police acting rationally given objective differences in criminality between black and white people.
To sum up this section, the lack of significance for race in models predicting who gets searched after controlling for obvious confounds suggest that search rates are not biased. Alternative ways of analyzing the question like hit rate tests and threshold tests imply the possibility of a slight bias but there are also plausible alternative explanations for these findings. Given this, we are not justified in concluding that the rate at which police search black people is racially biased. Importantly, if black people were being searched (or stops) at an unfair rate this would undoubtably lead to them being arrested at an unfair rate since even unfair searches of citizens will sometimes lead to arrests. Given this, the lack of racial bias in arrest rates evidenced in the next section constitutes powerful further evidence against the idea that search (or stop) rates are racially biased.
Arrest Rates
Turning to arrest rates, we can compare the rate at which black people are arrested for crimes to the rate at which black people are reported as the offenders of these crimes in incident reports given to the police by witnesses and victims. Doing so, research consistently finds either no evidence of a racial bias in arrest rates or a bias that is pro-black.
Relative to their appearance in incident reports, white offenders are more likely than black offenders to be arrested for robbery and assault while no difference is present for rape.
The rate at which black people are arrested for violent crime does not significantly differ from the rate at which they are reported to police for violent crime.
Across 22 crime types, there was no consistent pattern of black over or under representation among those arrest relative to their presence in police reports.
Across 24 crime types, there was no consistent pattern of black over or under representation among those arrest relative to their presence in police reports.
A weaker benchmark for testing bias in arrest rates comes from victimization surveys. These surveys are given to large random samples of Americans and ask them to describe any crimes they’ve recently been victims of as well as the demographics of the offender. Such surveys are weaker evidence than incident reports for at least two reasons. First, victimization surveys only include crimes which have victims while incident reports include victimless crimes for which there were witnesses (e.g. drug crime). Secondly, because not all crimes are reported to the police a discrepancy between victimization rates and arrest rates may reflect the behavior of the victims of crimes rather than the criminal justice system.
With that said, using the National Crime Victimization Survey (NCVS) as a benchmark and comparing it to arrest data from the Unified Crime Report (UCR) suggests if anything a pro-black bias in arrest rates for the early 2000s.
In 2018, the percentage of black offenders of violent crime did not significantly differ between the UCR and the NCVS. There was a gap such that Hispanics were over-represented among those arrested while whites were underrepresented. However, such data is likely to be fairly unreliable since it is not always easy to tell at a glance whether someone is white or Hispanic.
The other major benchmark often used to analyze bias in arrest rates is self reported crime rates. This is most often done in the context of drug crime. Liberals will say that blacks and whites self report using drugs at equal rates but blacks are arrested more for such crimes and that this is evidence of bias. Of course, self report data leaves open the possibility that people will lie but so long as the races are equally likely to lie about criminal activity this will not be a problem for an analysis of racial disparities. However, this assumption is not accurate. Multiple studies have used drug tests to show that African Americans are more likely than white Americans to falsely claim that they haven’t done drugs (Fendrich et al., 2005; Page et al., 1977; Falck et al., 1992; Feucht et al, 1994; Johnson et al., 2003). For this reason, self report data is not a valid benchmark for assessing racial bias in arrest rates.
Moreover, African Americans are more likely than white Americans to use drugs in high-crime areas, to use and buy drugs outside, to buy drugs from strangers, and to engage in other behaviors that elevate their risk for arrest above what you would expect given the rates at which African Americans report using drugs (Lagan 1995; Ramchand et al., 2006). Though to my knowledge undocumented, there may be similar behavioral differences in how other crimes are committed. To the degree that this is true, we’d expect black people to be arrested for crimes at a rate which is higher than the rate at which they commit those crimes even in a racially unbiased society.
Another line of evidence against racial bias in arrest rates is the fact that black police officers are no less likely than white police officers to arrest black citizens (Smith et al., 2001).
Actually, in a model that included far better controls than smith et al’s, Brown et al. (2007) found that offender race did not predict who white officers would arrest while black officers were more likely to arrest citizens who were black.
The final line of evidence I’m going to cite concerning arrests rates is the research showing that directly controlling for psychological factors eliminates the association between being black and the probability of being arrested. Two studies have shown this. First, Shwartz et al. (2019) found that race was unrelated to the chance of being arrested after controlling for sex, IQ, impulsivity, and previous time spent in jail in a sample of 1,331 ex-cons.
Second, Beaver et al. (2013) were able to reduce this association to statistical insignificance merely be controlling for age, IQ, and self reported history of violence.
To conclude this section, it is hopefully now clear the evidence for racial bias in arrest rates relies on faulty benchmarks while a closer look at the relevant data suggests there is no anti-black bias.
Bias in Who Police Kill
Turning to the rate at which police kill civilians by race, perhaps the most obvious benchmark to use is violent crime rates. Cesario et al. (2018) carried out a thorough analysis of this using multiple sources for crime rates, including using estimates from victimization surveys. The paper also distinguished between everyone killed by police and those who were killed by police while unarmed and not aggressing. For the majority of estimates, white people are over-represented among such killings. In nearly all cases there was no evidence for significant anti-black bias.
This analysis was done at the national level, but you could conduct a similar analysis at lower levels of aggregation. This was done by Mentch (2020) who conducted a county level analysis and found that black and Hispanic Americans were not over-represented among those killed by police relative to what you would expect given their local arrest rates. Another local analysis was done by Weistburst (2019) who found that black people were not over-represented among those killed by the Dallas police department relative to their arrest rates in Dallas.
Johnson et al. (2020) also conducted a county level analysis showing that minorities are less likely to be shot by police than are whites using a crime benchmark.
Using arrest data or violent crime rates is better than using population size as a benchmark but it is obviously imperfect as a estimate of what we really want, namely the frequency with which people engage in seriously dangerous violence in the presence of police officers.
The best benchmark we can use to get at this is the rate at which populations attack police officers. Such an analysis was carried out by Shjarback et al. (2020) who found that using such a benchmark rendered the probability of a black American being shot by police roughly 40% lower than the probably of a white American being shot by police. For Hispanics, there was either no difference or evidence of an anti-Hispanic bias depending on whether the benchmark was the rate at which people killed police or the rate at which they assaulted police.
Another line of evidence related to police shootings, but somewhat broader, concerns studies which attempt to control for situational differences and estimate the bias in the rate at which police use force. Taking these studies as a whole, they tend to show an anti-black bias in police behavior. However, this is because studies supporting this conclusion are more likely to be published than are studies which contradict this view. Correcting for this publication bias, there is no relationship between suspect race and the rate at which police use force.
Another line of evidence against racial bias is the fact that black police officers are not less likely than white police officers to kill black citizens. This is the finding of Meinfeld et al. (2018)
Similarly, Johnson et al. (2019) find that blacker police forces don’t kill fewer black civilians.
As should now be clear, the weight evidence does not favor the view that there is an anti-black bias in the rate at which people are killed by police and in fact the strongest evidence indicates that there is a pro-black bias in the rate of such killings.
Incarceration Rates
Turning now to incarceration rates, the most commonly used benchmark to compare incarceration rates to is arrest rates. If done in an overly broad way, such a comparison will have a high potential for error in the direction of a false positive, or erroneously concluding that a system is racially biased when it is not. This is because more serious offenses naturally lead to longer periods of incarceration and so a group which is on average sentenced for more serious offenses will build up a larger prison than another population even if the total number of arrests for the two groups is the same. For this reason, it is always important to make this comparison within the constraints of a single crime category.
When carried out in this way, research finds that arrest and incarceration rates correspond pretty closely. For instance, when looking at data on violent crime from Pennsylvania for 2003-2007 Harris et al. (2009) concluded that “the representation of blacks, whites, and Hispanics among offenders admitted to state prison and in the prison population corresponds closely to their representation in arrest statistics.”
Steffenmeier et al. (2011) produce a similar finding when looking at national data for 1980 – 2008. The rates don’t perfect match, but which is greater depends on the crime and there’s no systematic bias evidence across crime types.
Research by the New Century Foundation (2005) produced similar results:
Thus, incarceration rates seem to about as racially biases as are arrest rates and as we’ve already seen there are good reasons for thinking that arrest rates are not racially biased.
It is also worth noting that the black-white difference in likelihood of being incarcerated is not statistically significant if you simply control for age, IQ, and self reported history of violence (Beaver et al., 2013).
Given all this, we are justified in concluding that the rate at which black people are incarcerated probably does not reflect racial bias to any significant degree.
Sentencing Length
Moving on from incarceration, most research finds that if you control for variables like criminal history and offense severity race does not significantly predict sentence length. Sometimes, proponents of systematic racism will create a misleading picture by citing a few of the studies from this literature which do find bias and simply neglect to mention that a far greater number of studies which find no such bias as a more comprehensive list of studies makes clear.
The earliest meta-analysis done on this topic was Kleck (1981) who used a “vote counting” method and found most studies which controlled for criminal records did not find evidence supporting racial bias in criminal sentencing.
Similarly, Pratt (1998) combined data from 47 studies via meta-analysis and found that race was unrelated to sentence length after controlling for offense severity and criminal history.
Thus, the weight of meta-analytic evidence supports the view that sentencing is not racially biased.
Simon et al. (1996) is probably the most informative single study on sentencing because it not only controlled for crime type, victim injury, criminal history etc., but also IQ. It produced two findings of note. First, holding all other variables constant IQ is a significant predictor of sentencing. This demonstrates that the rest of the literature on sentencing has omitted from its models a variable which differs by race and impacts sentencing. Secondly, it found that in a model which corrected for IQ as well as the standard criminological controls, race was not related to sentence length.
Lastly, it is worth noting that black and white judges sentence black and white offenders similarly suggesting that racial animus is not the cause of the racial gap in sentencing. To my knowledge, Ulhman, (1978) was the first study to document this fact.
The same was found by Steffenmeier et al. (2001).
To conclude, meta-analyses show there is no racial bias in sentencing. Moreover, sentencing disparities are similar regardless of the race of the judge doing the sentencing. Perhaps most importantly, all research but one study fails to control for IQ, a variable which differs by race and predicts sentencing, and this study finds no evidence of racial bias. Clearly then, on net the evidence does not justify thinking that racial bias is present in sentencing rates.
The Death Penalty
Finally, let’s examine racial bias in the rates at which people are sentenced to death. Reviewing the literature done on the topic up to 1981, Kleck (1981) found that studies had been roughly equally likely to provide evidence for and against this view.
Kleck goes on to note that the rate at which blacks were executed between 1930 and 1967 was 7% less than you would expect given the rate at which black people commit murder and the rate at which white murders had been executed.
I’ve been able to find 14 studies done after 1981 which assessed the impact of a defendant’s race on the chance of them receiving the death penalty. Of these 14 studies, 11 found no effect for race while one indicated an anti-black bias and two indicated a pro-black bias.
Whites were more likely to receive the death penalty (Table 1)
The single study I found evidencing an anti-black bias is Becket et al. This analysis was based on a small sample of only 77 cases and in order to make the impact of race be statistically significant it was necessary for the paper to adopt a lower bar of evidence than is usually utilized in social science so that a p value greater than .05 but less than .10 would be counted as significant. Given that findings with p values at .05 are already notoriously unreliable and predict a replication rate of less than half, this study is extremely weak evidence and is certainly overwhelmed by the rest of the relevant research (Zwet et al, 2022).
I consider Heilbrun et al. (1989) to be the most informative study on death sentencing because it is the only study to include psychological measures in their model. Specifically, it was shown that once murders were categorized according to their scores on measures of intelligence and anti-social personality there was a pro-black bias in death sentencing.
In summary, the totality of the evidence strongly supports the conclusion that there is no anti-black bias in death sentencing and more modestly supports the view that, once psychological variables are accounted for, there is a pro-black bias in death sentencing.
Concluding Thoughts on Crime
Here I want to make a view concluding comments. First, it is regrettable that we have a society in which the probability of a criminal being incarcerated is roughly the same across racial groups because this entails that the probability of being a victim of crime cannot be the same across race. After all, if some groups have more criminals than other the only way to equalize the number of free criminals across groups is for a greater proportion of criminals to be caught among groups with higher crime rates.
Secondly, there is an intense anti-white bias in the murders and victims that our society chooses to ignore. The media would lead you think that being killed while unarmed is a leading cause of death among black Americans. In fact, happens less than 50 times per year and many other causes of death which are totally ignored are far more common.
To put these numbers in a historical context, consider that roughly 3,500 blacks were lynched in the United States between 1882 and 1968. At its height, around 100 black Americans were lynched per year.
We hear about black people who were lynched in the past and we hear about black people killed by police today. We don’t hear about the white people killed by blacks despite this being far more common. The value judgement implicit in this difference in attention is obvious.
In any case, it is hopefully now clear that the evidence does not justify thinking there is an anti-black bias in the criminal justice system.
Historical Explanations
If we accept what I’ve argued thus far, we still might think that racial inequality is caused by racism of the past even if our current institutions have been made unbiased or even biased in the opposite direction. Generally, arguments of this sort rely on two assumptions. First, that various institutions of the past caused large and unfair racial gaps in how people’s lives turned out. Second, unfair inequality in the past causes inequality we see today. Prior to dealing with any specific historical theory, I want to explain why both of these assumptions are, in general, likely to be false.
It should also be noted that most people implicitly interpret the question of what caused black poverty as meaning “how poor would black Americans be if they were all still brought to America but immediately made into free and fairly treated citizens rather than slaves?”. Historically, this happening would have basically been impossible. Clearly, thinking that this question is the same as asking whether racism caused black poverty is fallacious. That said, we can acknowledge this and then go on to answer this implausible hypothetical anyhow.
On Inheritance and Generational Poverty
Beginning with the second assumption, that past economic inequality causes current inequality, the first thing to note is that the black-white wealth gap among those who have no inheritance is only 28% lesser than the gap among those who do receive inheritance. The white-Hispanic wealth gap is actually largest among those with no inheritance (Thompson et al., 2015, Table 6). This sets an upper limit on how much of racial inequality can plausibly be attributed to past racist institutions that inhibited black people’s ability to accumulate wealth. That upper limit having been established, the next thing to note is that wealth doesn’t transmit very well across generations for African Americans. Specifically, Toney (2016) finds that a doubling of the wealth of a person’s grandparents predicts a 60% increase in their own wealth if they are white but only a 9% increase in their wealth if they are black. The same basic point is made by the following chart from Pfeffer et al. (2018):
This lack of wealth transmission in black families is made especially clear by Chetty et al. (2018) who were given data by the IRS that allowed them to conduct a statistical analysis on the entire US population that filed taxes between the years 1989 and 2015. They write: “A black child born to parents in the top quintile is roughly as likely to fall to the bottom family income quintile as he or she is to remain in the top quintile; in contrast, white children are nearly five times as likely to remain in the top quintile as they are to fall to the bottom quintile”.
What this research implies is that the current link between wealth within black families is such that we would not predict that modern black people having significantly richer ancestors would benefit them much at all in the current day.
Seemingly, the lack of wealth transmission among African Americans is significantly explained by their spending habits independent of income. Research shows that black people have lower saving rates than white people even when they have the same incomes (Dorgo, 2003). More dramatically, Hughes (2018) documents that black Americans spend more on goods like fancy cars and clothing than do white people despite being poorer than them and that such spending directly accounts for around 20% of the black-white wealth gap. Hughes goes on to note the following:
“To make matters worse, spending patterns are just one part of a larger set of financial skills on which blacks lag behind. Researchers at the Federal Reserve Bank of St. Louis followed over 40,000 families from 1989 to 2013, tracking their wealth accumulation and financial decisions. They developed a financial health scale, ranging from 0 to 5, that measured the degree to which families made “routine financial health choices that contribute to wealth accumulation”—e.g., saving any amount of money, paying credit card bills on time, having a low debt-to-income ratio, etc. At 3.12, Asian families scored the highest, followed by whites at 3.11, Hispanics at 2.71, and blacks at 2.63.
Next, they asked if education accounted for the differences in financial habits by limiting the comparison to middle-aged families with advanced degrees. Surprisingly, they found that the racial gap in financial health-scores didn’t shrink; it widened. Highly-educated Asian families scored 3.49, comparable whites scored 3.38, comparable Hispanics scored 2.94, and comparable blacks remained far behind at 2.66.”
Thus, the weak generational transmission of wealth seen among African Americans seems to be a product of their own behaviors.
That said, even these analyses over-state the causal link between wealth and income across generations. Often we speak as if the reason that rich parents tend to have rich kids is because having rich parents causes people to be rich. In fact, in the United States roughly 41% of the variation in income is explained by genes while only 9% is explained by the family home environment (Hytinnen et al., 2019). The necessary implication of this is that the vast majority of the correlation in income between parents and children is due to genes rather than the environment.
Of course, we also should not assume that the small amount of income that is explained by the home environment is all explained by parental income. Research utilizing study designs which rule out the influence of genetics finds that the effects of parental economic success on offspring economic success are weak or non-existent across one to two generations implying that even a weak causal effect is implausible across many generations.
Destruction of parental wealth via the American civil war had only a very weak effect on offspring income (a 0.4% decrease in income per 10% decrease in parental wealth).
That even dramatic changes in income aren’t transmitted across many generations is also evidenced by many recent events in history. Consider, for instance, the amount of time it took the Irish to rebound from extreme repression by the English, Jewish people to fully rise economically following emancipation, Japan to rebound following WW2, and countries like Estonia to recover from communism. Nothing about any of these events would lead us to think that events of the past can keep a population poor for many generations to come.
Further evidence of the genetic transmission of wealth comes from Clark (2021). The idea behind this paper is that if wealth is being transmitted purely due to genetics then how similar two relatives are in wealth will be a simple function of how genetically related they are. Importantly, this model makes predictions which are hard to explain if the environment is playing any significant role. For instance, because people are as related to their 1st cousins as they are their great grandparents, this purley-genetic model predicts that people’s wealth will be equally correlated with the wealth of their cousins and great grandparents even though most people have spent time with their cousins and never met their great grandparents. It also predicts that the wealth correlation with great-great grandparents will be in between that of 1st and 2nd cousins and that, moreover, the wealth correlation between people and their second cousins will be equal to their correlation in wealth with their great-great-great grandparents. Using data on 402,000 English individuals who lived between 1750 and 2010, it was shown that relatives similarity in wealth (and education and occupational status) perfectly aligned with the specific predictions of this genetic model. The odds of this pattern occurring if the environment was significantly involved is nearly zero.
To sum up this section, racial wealth gaps are largely present among people with no inheritance. The correlation between parental and offspring wealth is so weak among blacks that having significantly richer ancestors would not have benefited them much. The correlation we usually see between parent and offspring income is mostly due to genetics. And the direct effect of parental economic success on offspring economic success is so weak that a significant effect lasting across many generations is just not plausible. These constitute a strong set of back ground reasons to doubt many common explanations of racial inequality. Given these facts, we should require very strong evidence in favor of such narratives before we accept them as true.
The Stubborn Persistence of Inequality
We’ve seen that there is a general reason to doubt that past inequality would produce modern inequality. There is also a very general reason for doubting that past inequality was largely caused by racial bias. Generally speaking, if X is causing Y then a decrease in X should predict a decrease in Y. But that is not what we see when we look at what has happened to racial inequality as we’ve massively decreased anti-black racial bias. For instance, racial inequality in wealth and unemployment have both gotten far worse since the mid 20th century.
The same is true for crime over the period of 1850 – 1974 (Calahan, 1979).
With respect to home ownership, racial inequality declined significantly between 1870 and 1900 but has remained fairly stagnant since then despite a huge amount of racism still supposedly being present in the early 20th century.
With respect to out of wedlock birth, the black-white gap has increased in absolute terms but decreased in relative terms since the 1930s.
If we instead measure the proportion of children under the age of 14 living with only one parent, we find that both the absolute and relative gap between black and white Americans increased in the 20th century (Ruggles, 1994).
Assessing the historical trend in income is slightly more complicated. Often, people report statistics showing that the ratio of black worker income to white worker income has increased over time. This is true, but caused by the fact that prison sentences and unemployment have removed a disproportionately large share of unproductive people from the pool of black workers. To remove this bias, we should just look at the income ratio of all black people to all white people. If we are interested in racism, we should also restrict our analysis to men because group differences in the rate at which women entered the labor force could distort our result. And of course we’ll want to restrict our analysis to working age men so changes in the age distribution of groups over time don’t distort things. Doing so, we find that racial inequality in income is the same today as it was in 1950, with the ratio of black to white income being roughly 0.51 the whole time.
This is similar to what is seen in Brazil, 0.50, and England, 0.63 (Bucciferro, 2017 ; Collinson, 2020). In modern day Detroit, the ratio is 0.41 (Danziger et al. 2014). In Chicago its 0.43. That same ratio was 0.53 in the South of America in 1870 (Lindert and Williamson, 2016). In 1880, the ratio of black to white income in the south was 0.58 (Ng and Virts, 1993). (The national ratio was lower because black people tended to live in the South which was poorer than the north and have over time moved out of the South).
Among farm workers in the rural south in 1880, a context in which we’d expect to find the biggest effects of racial animus since slavery ended, the ratio of black to white income was 0.79 (Ng and Virts, 1993). To day, if you control for age, education, work experience, where someone lives, and marital status, that ratio is 0.81 (Farkas 1996). The near identical values of these two figures should greatly lessen our confidence in the mainstream narrative concerning race.
To find levels of inequality significantly greater than what is observed today, you have to go back to the time when slavery was still ongoing. Thus, despite segregation and Jim Crow and the klan, etc., the level of racial inequality seen in the American south has been in line with what is seen today in large long standing black populations ever since 1870. Given this, there is no especially great level of racial inequality that we need to invoke racism to explain. The only kind of explanation that seems appropriate will point to things that black people in present day America, England, and Brazil, as well as the south of 1870, all share in common, and their degree of experience with racism is obviously not such a common factor. Obviously, we should not explain this inequality by pointing to a variable like racism which differs heavily between these locations and times despite the uniformity of inequality observed.
The only places where the ratio of black-to-white incomes are significantly higher is in nations where the black population consists mostly of voluntary immigrants. For instance, the ratio of black to white income is roughly .80 in Canada, .84 in France, and .77 in America when just looking at black immigrants. (CA; Algan et al., 2010; Pew, 2015; Anderson, 2013).
As we’ve already seen, the ratio is lower in Latin America. It is even lower in Africa. For instance, in South Africa, the ratio is 0.16 (Desilver, 2013). The reason that black immigrants tend to do relatively well is therefore not because they come from populations of black people who generally do well relative to whites. Rather, it is because, for the most part, only elite black people from Africa and Latin America have the ability to immigrate to Europe and North America. Of course, it is, by definition, also true that economically elite native black Americans do better relative to whites than is typical. The existence of these immigrant populations is thus no more evidence that fairly treated blacks will do better than is the fact that there are richer than average black people within every black population.
The fact that racial inequality has not lessened as racism has is thus another background reason to doubt common racism based explanations of past inequality and to require a very high bar of evidence be met prior to accepting them.
Redlining and GI Bills
Turning to more specific historical hypotheses, let’s begin with redlining. Writing in the New York Times, Jackson (2021) explains that the term redlining comes “from government homeownership programs that were created as part of the 1930s-era New Deal. The programs offered government-insured mortgages for homeowners — a form of federal aid designed to stave off a massive wave of foreclosures in the wake of the Depression.” These programs created color coded maps to asses the riskiness of giving loans in different areas. Jackson explains that “Though the maps were internal documents that were never made public by the federal government, their ramifications were obvious to Black homeowners who could not get home loans that were backed by government insurance programs.” and goes on to cite a historian who explains that “private lenders started using the government’s map lines as well — effectively barring Black home buyers from qualifying for secure mortgages from many mainstream banks.”.
Similarly, writing for Vox, Chang (2018) explained that “The housing administration refused to back loans to black people — and even people who lived around black people. FHA said it was too risky.” And Perry et al. (2019) explained through Brookings that “Redlining was the practice of outlining areas with sizable Black populations in red ink on maps as a warning to mortgage lenders, effectively isolating Black people in areas that would suffer lower levels of investment than their white counterparts.”
The maps people are referring to initially were made by the Home Owners Loan Corporation in the early 1930s. These maps indicated how risky it was to give out a loan in various neighborhoods in major US cities. It is true that black people were quite rare in neighborhoods marked as low risk, but it is also true that the vast majority of people living in “redlined” areas, roughly 85%, were white (Greer, 2013).
Secondly, after controlling for obvious markers of loan risk the racial composition of an area only had an extremely weak relationship with the risk the HOLC assigned it (Greer, 2013).
As we saw previously, in the modern day environment black people are more likely than white people to default on a loan even after controlling for variables like a credit score. Given this, we should require some further evidence before concluding that these maps assigned more risk to black areas than was justified. Moreover, on average red lined areas with lots of white people in them had better economic markers than did majority black redlined areas (Maas, 2021). So we have decent reasons to think that the maps were not unfairly racially biased.
We also have good reason to think that these maps didn’t matter much at least at the level of national racial inequality. First, the HOLC did not have a policy against giving out risky loans (Jackson, 1980). In fact, the limited data we have on who they gave loans to suggests that black people were disproportionately favored as loan recipients from the very beginning (Hiller, 2003). Certainly, by 1940 black home owners were over-represented among people getting loans through the HOLC (Michney et al., 2020).
Some people accuse the Federal Housing Administration (FHA) of using the HOLC maps, but this is just speculation as the maps the FHA used during this time period have been lost (Maas, 2021).
If is also often argued that racial inequality to get home loans was further exasperated by the GI bill. This bill was intended to give various benefits to veterans of WW2, but it has been argued that these benefits were denied to black vets. For instance, it is often said that the VA was less likely to back home loans for black vets.
For both the FHA and VA it is true that black people were underrepresented among people they gave loans to. (Michney et al., 2020).
Unfortunately, I’ve not been able to find data with differentiates between these two organizations. It would be valuable to do so because economic concerns may explain the racial gap in FHA backed loans though this is a less plausible explanation for VA loans. Without more data, it is not possible to tell the degree to which this disparity was unfair.
Regardless, the above chart makes clear that the vast majority of white and black people who got home loans did not use the VA or the FHA. Moreover, we have good reason to think that nothing occurring between the mid 1930s and the mid 1940s increased racial inequality in access to home loans. First, the gap in property value between blacks and whites changed such that in 1940 the average black home was worth 35% what the average white home was and in 1960 it was worth 56% what the average white home was (Collins et al., 1999).
We have data reaching further back for home ownership. We can see that not only did the racial gap narrow between 1930 and 1950 but that, moreover, the gap has stayed within a few points of 25 percentage points since 1910 (Collins et al., 2011).
We also have good reason to doubt those who claim that the racial composition of an area continued to influence lending decisions long after the post war era. Empirical research in to the impact that the racial composition of a neighborhood has on the probability of someone living in that neighborhood getting a loan did not begin until the 1970s. Since that time, it’s been consistently shown that the racial composition of a neighborhood has no direct impact on the probability of loan approval.
In demographically stable areas, race had no direct impact on the number of loans given in an area. Loans were 9% less likely to be accepted in areas with quickly changing demographics.
The racial composition of a neighborhood had no direct effect on the rate at which loan requests were rejected
It is true that blacker neighborhoods were given fewer loans, but this is explained by the rates of poverty in such areas. As is the case for the current loaning environment, we don’t have evidence that black people in the mid 20th century were denied loans beyond the degree that would be fair given their actual probability of paying a loan back.
It is also worth noting that the GI bill provided many with benefits in the form of education and job training. The proportion of black vets who utilized the GI bill’s education and training benefits, 49%, was higher than the proportion of white vets who did so, 43% (Katznelson et al., 2008). The data these figures are based have been criticized by historians on the grounds that the sample data is derived from 15,000 vets and the total population of vets is far greater than 15,000 (see previous citation). Obviously, 15,000 is a quite large sample which led to a suitably small margin of error, this criticism is purely based on the statistical illiteracy of the average historian.
It has also been argued (see same citation as before) that the education and job training was of lower quality for blacks than for whites and so increased racial disparities despite what these use figures suggest. This is true but tells us nothing about whether it increased racial inequality. To answer that we’d have to know about the quality of training given to each group relative to their pre-existing skill set.
As I’ve already noted, racial inequality in income has been stable for a very long time and so it is unlikely that the GI bill had a significant impact on racial equality.
Segregated Schooling
Moving on to segregated education, the first thing to point out is that school inequality was primarily (though not entirely) driven by differences in local poverty rates. At that time schools were mostly funded locally because the justification for taking one person’s money and spending in on the education of someone else’s child was that this would improve the local economy that the person funding the education lived in. This rationale lead to decreased funding for poor children of all races, though of course poverty was more common among blacks. As should be obvious, this reasoning, whatever we think of its legitimacy, is not racist.
That said, there is a sense in which lower funding for black schools violated the “separate but equal” policy that had been used to justify segregation. Consequently, even in the segregated south indicators of school quality were quickly tending towards equality prior to the passing of Brown v Board (Card et al., 1992).
This fact was widely recognized at the time. And it is noteworthy that this was a race specific sort of equality. Poor white children were still going to far worse schools than the median white child, but major federal legislation combating this inequality was not enacted until the mid 1960s.
Having nearly achieved equality in school quality throughout the south, in Brown vs Board the supreme court ruled that the material equality of black and white schools was not sufficient to provide true equality because black children knowing that they could not go to the same schools as white children would cause them to notice they were considered inferior by society and this in turn would lower their self esteem. The court wrote “does segregation of children in public schools solely on the basis of race, even though the physical facilities and other “tangible” factors may be equal, deprive the children of the minority group of equal educational opportunities? We believe that it does… “the policy of separating the races is usually interpreted as denoting the inferiority of the negro group. A sense of inferiority affects the motivation of a child to learn. Segregation with the sanction of law, therefore, has a tendency to [retard] the educational and mental development of negro children and to deprive them of some of the benefits they would receive in a racial[ly] integrated school system.””
Notably, the evidence the court cited to support this opinion is not at all persuasive. The most famous concrete work of science they relied on was a study showing that black children in segregated schools thought white dolls were nicer and more likable than black dolls. This was true of children in segregated schools, but the very study the court cited showed that this was even more true of children in integrated schools (Clark, 1947).
The only sense in which the integrated school lessened this association for black children was by seemingly increasing the number of black children who more identified with white dolls than black dolls from 29% to 39% (table 4). And even this is a simple correlation for which there are many possible explanations (e.g. northern blacks were economically better off than southern blacks and may have been more white). Notably, today the “doll test” gives the same results as it did then (Young, 2008).
As noted previously, in the early 60s, prior to the time at which most southern states began to seriously desegregate their schools, black and white people had similar levels of self esteem. Since then, black self esteem relative to white self esteem has risen (Twenge et al., 2002). Given this, it is now clear that the “doll test” is not a valid measure of a group’s self esteem.
That said, despite a lack of empirical support, as the court noted the their view was the view of the majority of experts at that time (Max, 1948).
In terms of the effect that desegregation had, the first thing to say is that there are senses in which integration has and has not happened. In the 70s, schools became significantly less segregated than they had previously been (Wilson, 1982). The news sometimes reports that desegregation has not meaningfully occurred because for the last few decades the frequency with which minority children go to schools that have non-white super majorities has increased. This is true, but it is not due to white racial bias as is often implied. This trend has occurred because minorities used to make up something like 15% of school children and now they make up more than half. Accounting for this change in the underlying population size, we find integration levels have been stagnant or have modestly increased since the 1980s after significantly improving in the decade prior (Reardon et al., 2014; Fiel, 2013). Regardless, it is true that minorities still often go to schools where the students are nearly all minorities. In fact, the proportion of black students who attend the average white student’s school was less in 2005 than it was in 1970 (Reardon et al., 2014).
Given this, it is perhaps not surprising that the period in which integration occurred did not coincide with significantly increased equality in terms of income, crime, or net worth, etc. As we’ve already seen, there was no self esteem deficit among blacks to begin with and so of course this was not remedied either. It is true that racial gaps in educational attainment have lessened over the last 50 years or so, but these gains have not led to economic gains and so it is not clear that they’ve been of much value.
Slavery
Turning finally to slavery, the most informative work I’ve seen on the direct effects of slavery across generations is Sacerdote (2005). This paper compares life outcomes for the children and grandchildren of enslaved and free black Americans. After controlling for the negative economic effects of living in the south post slavery, Sacerdote finds that these groups converged after 2 – 3 generations.
To be specific, The children of slaves were 8% less likely to be in school than the children of free blacks. For the grandchildren of slaves, there was no significant effect. Similarly, the gap in months of schooling between the grandchildren of slaves and free blacks was a statistically insignificant 0.3 months. Moreover, the children of slaves incomes (estimated based on occupation) did not significantly differ from the children of free blacks. The descendants of slaves were 6% more likely to work in manual labor, but this was not statistically significant. Finally, Sacerdote finds that the rate of home ownership was 34% for homes headed by the children of slaves and 32% for homes headed by the children of free blacks. Thus, the negative economic impacts of slavery on black Americans probably only lasted for a couple generations.
Controlling for current region is important. Studies which adopt a similar approach to Sacerdote but fail to control for current region find more lasting negative effects of slavery (e.g. Price, 2017). For whites and blacks, the south was poorer than the north and ex slaves tended to live in the south. So it is necessary to address this bias if we are trying to measure the direct causal effects of slavery on economic outcomes.
A much weaker approach to studying the effects of slavery is to examine how historic regional variation in the prevalence of slavery predicts modern regional variance in characteristics like poverty and crime. This is problematic in the first place because areas with lots of historical slavery will also tend to be very black areas and research in this area often fails to control for the proportion of an area that is black (e.g. Bertocchi et al. 2014).
Empirically, we know that failing to control for local demographics can cause misleading results. For instance, controlling for poverty, counties with a greater history of slavery have more violent crime today. However, this is just because black populations have higher crime rates even controlling for poverty. Controlling for the proportion of a county that is black, the effect goes away (Gouda et al., 2013).
Not all research purporting to show a contemporary effect of slavery utilizing regional variation makes this mistake. For instance, Reese et al. (2015) show that historical slavery rates predict modern levels of racial inequality in educational attainment after controlling for regional demographics. However, this is to be expected as it’s long been known that better educated blacks have historically been more likely than less educated blacks to move out of the south (Margo, 1988). Consequently, this sort of analysis is doomed from the start and cannot substantiate the claim that slavery has a lasting effect on racial inequality to this day.
To sum up this section on history, the best lines of evidence on red lining, the GI bill, school segregation, and slavery, suggest these historical events likely don’t have a significant impact on racial inequality today and, in some cases, probably didn’t even have a racially biased effect at the time. Given what we know generally about how racial inequality has persisted over time and the general lack of effect that parental economic success tends to have on their descendants, none of this should be surprising.
Conclusion
Ultimately, I’m just arguing that we should recognize something that should be obvious. History is full of societies which practiced discrimination. We all have an intuitive idea of what they looked like. In such societies, those with power didn’t openly condemn the discrimination they were secretly perpetuating. Such societies didn’t ostracize people for using words that offended the people they were oppressing as we do with racial slurs aimed at minorities. In genuinely racist societies, people aren’t fired or “canceled” when it is revealed that they are racist.
The society that we live in is one were major corporations, institutions of education, and the government, openly talk about how they try to avoid hiring or admitting white people. It’s one where people can be fired and ostracized for criticizing non-whites but where people are rarely punished for criticizing white people as the American left does openly. It’s a society which says that phrases like “White lives matter” and “It’s okay to be white” are immoral statements of hatred. As in many racist societies of the past, we live in a culture where we are taught that one racial group (whites) is to blame for many of the problems of everyone else. And we are taught that it is racist, and therefore immoral, for white people to attempt to defend themselves from this charge as I’ve done here. Increasingly, we are told that we must trust the “life experiences” of those who blame whites for their problems and that the very act of looking for rational justification of these claims is itself suspect.
White people are expected to accept that they, and only they, share an inherent evil, racism, for which they can never fully repent though they must relentlessly try to nonetheless. This process may cause whites suffering, but, we are told, to be pre-occupied with the suffering of whites is itself racist.
The only thing unusual about our culture’s racism is the number of white people who have been socialized into participating in their own oppression. This victimization of whites is already significant. It inhibits white people economically, holds them back in education, subjects them to crimes which are systematically ignored, and sometimes directly damages their mental well being. As racial inequality continues to increase and white people become a demographic minority, these problems will probably only become worse. Certainly, the history of what happens when the majority (future non-whites) blames their unending problems on a minority (future whites) gives us reason for pessimism.
For these reasons, it is important that we recognize the sense in which our society truly is systematically racist and work to correct this before the effects of anti-white ideology are so great that they are simply impossible to ignore.
Appendix: Tedious Refutations
Mitchell (2005) on Bias in Criminal Punishment
Mitchell (2005) conducted a meta-analysis supposedly finding the opposite. Mitchell expressed his findings in terms of an odds ratio and combined data not just on sentencing length but also on whether a defendant was incarcerated to begin with. Mitchell found that in at least some contexts the odds of a black defendant being more harshly punished than a white defendant was greater than random chance would predict.
Notably, Mitchell emphasized that this effect was statistically significant but practically small. Mitchell writes “The random effects mean odds ratio for the non-Federal data is 1.28… which is statistically significant but substantively small. A more intuitive sense of this mean effect size can be gained by transforming this effect size into percentages. If we assume a punishment rate (e.g., incarceration rate) of 50% for whites, then this overall mean odds ratio translates into a punishment rate of approximately 56% for African Americans.” It is also noted that this assumption of a 50% punishment rate for whites leads to a greater racial difference than any other selected value would have.
There are at least a few reasons to think that this is an over-estimate. First, looking at Table 3 of the paper shows that there are many moderating variables which could have been simultaneously set at a value which would increase our ability to detect unfair bias but which were not. For instance, the mean effect size among published studies was 1.35 while the mean effect size for unpublished data was 1.14. We can also see that no significant effect of race was found in the 10 studies which specifically controlled for victim injury and the mean effect size was already reduced from 1.34 to 1.14 in the 31 studies which controlled for weapon possessions/use.
Mitchell addresses this question in part writing that “the results of the multivariate model were used to estimate the average effect size in contrasts that utilized more precise measures of criminal history and offense seriousness, and included controls for both type of defense counsel and method of disposition, while holding all other variables at their respective means. Based on this procedure, the average odds ratio effect size was 1.13, which is approximately half the magnitude of overall mean odds ratio (1.28).” However, it is not reasonable to set variables like publication status or whether victim injury was measured to their mean value in the data set. Rather, these variables should be set to the values that are expected to give the most accurate results (unpublished, measured injury, etc.). It may be that this was not done because there were not enough studies done with this level of rigor, but it is also clear that the effect size would be expected to decrease further if such studies were conducted and meta-analyzed. Given that each of these variables had a large impact on the effect size, and we’re dealing with a weak effect size to begin with, it is more probable than not that the already reduced effect size of 1.13 would be reduced to insignificance in studies of such quality. On these grounds alone, we are justified in saying that this paper does not show that there is racial bias in sentencing.
But the problems for this paper go deeper. Specifically, I’m going to argue that this meta-analysis is fraudulent by showing that the way the data was recorded for the meta-analysis systematically differs from what the actual source studies say in a manner which consistently inflates the estimate of anti-black bias.
To do so I’ll be using a representative subset of studies used in the meta-analysis given in a version of this analysis presented in a government report which displayed a chart showing how a subset of the studies analyzed were coded (Mitchell, 2004). In some cases, this chart only showed a subset of the effects recorded from a given study included in the meta-analysis and when that occurred I referenced figure 1A to see the full set of effect sizes analyzed.
Many of these studies are old or only ever appeared in books. Because of this, out of this subset I was only able to review 13 of these studies. Of these, 6, or 46%, of studies had results that had been incorrectly reported by Mitchell and in every case the effect of the error was to exaggerate anti-black bias.
First, there’s Engen (1999). Mitchell et al reports this study as having a sample of 11,290 and as having found that blacks are punished significantly more harshly than are whites. However, there are no models in this paper that have a sample of this size, the models actually have samples significantly larger than this, meaning it should be given greater weight in the meta-analysis than it was, and the paper actually finds that black people receive less harsh sentences than do whites to a statistically insignificant degree.
Second, there’s Crew (1991). Mitchel reports this paper as having found that blacks are more harshly punished than whites to a insignificant degree in a sample of 108 convicts. The actual sample size was 228 and because this effect size is lesser than the overall effect size produced by the meta analysis the impact of under-estimating the study’s sample size is to inflate the meta-analytic result.
There are also issues with Hanke (1995). Mitchell et al codes this study as showing that blacks experience far harsher outcomes than whites. The study was on the sentencing of 685 women convicted of homicide in Alabama between 1929 and 1985. The study found that whites were on average given longer sentences. The authors state this in writing “For those for whom sentence information was available, the average sentence length overall was 11.4 years, excluding life and death sentences. For African American homicide offenders the average sentence was 10.9 years; for whites it was somewhat more,13.4 years”, and this fact can also be seen by looking at their statistical tables.
The study did find that harsher sentences were given for crimes featuring a black offender and white victim for homicides done before 1964. Since 1965 this effect has been statistically insignificant. Looking at the forest plot showing the coding for every effect size included in the meta-analysis (Figure A1), we can see that Mitchell ignored the effect size for race of offender and only included in the meta-analysis effects showing blacks were punished more harshly.
Turning to Miethe and Moore (1987), Mitchel records this paper as having produced an (ns) effect size indicating anti-black bias in the 1978 data set, when in fact the model shows a (ns) pro-black black bias.
Next, there’s Petersila (1983). Mitchell et al records this study as analyzing data from Texas and showing that blacks are more harshly punished than whites to a statistically insignificant degree. However, this paper also includes data from California showing blacks are punished less harshly than whites to a statistically insignificant degree. Only the effect size from Texas was included in the meta-analysis
Finally, there’s Albonetti (1991). Mitchell et al records this study as having produced one effect size which showed blacks were sentenced more harshly than whites to a statistically significant degree. Mitchell et al does not include in the meta-analysis a second effect size produced by the same study showing whites were punished more harshly to a statistically insignificant degree.
Thus, in nearly half of the cases I was able to review Mitchell et al incorrectly reported data in a way that inflated their estimate of anti-black bias. The best explanation for this that I can think of is that Mitchell conducted the meta-analysis in a dishonest way to produce the result he desired. Even doing so, he produced a meta-analysis which, as I’ve argued, upon close inspection actually failed to evidence bias.
Ross (2020) on Police Shootings
Using crime rates as a benchmark by which to asses racial bias in the rate at which police kill people has been criticized on the grounds that crime rates are only relevant benchmarks for the rate at which police justifiably kill civilians. It could be that police exhibit no anti-black bias in the rate at which they kill people who are actually an imminent danger in their presence but they do exhibit an anti-black bias in the rate at which they unjustly kill civilians who are not posing any danger. Such killings are rare enough that they may not significantly alter the total proportion of people killed by police who are black and so comparing this figure to crime rates can misleadingly hide this sort of racial bias (Ross et al., 2021).
After making this critique, Ross et al. (2021) conducted an analysis concluding that police are not bias with respect to the criminals they kill but exhibit an anti-black bias with respect to the innocent people they kill.
To reach this conclusion, they counted anyone killed by police while armed as a criminal and anyone killed while unarmed as innocent. Because whites are more likely than blacks to own a gun, such a procedure is bound to inflate the white crime rate relative to the black crime rate and thus inflate the false positive rate of this method of detecting anti-black bias.
Pew (2017)
More importantly, having a gun is not a crime and not having a gun does not entail innocence. Around the time this paper was released, I examined the the 14 black people the Washington Post Database listed as having been recently being fatally shot by police while unarmed and found that, seven of them, or half, were killed for clearly justifiable reasons.
Five witnesses backed up the police’s story that “Pheap choked him, grabbed his Taser and used it on him during a struggle at a local apartment complex”
Despite being coded as an “unarmed shooting”, according to her own niece Atatiana pointed a gun at the window outside of which police were located prior to being shot.
Police shot Pudlick, who had two guns in his car, after he fleed from police in his vehicle and began to drive onto the side walk narrowly dodging civilians
Given this, Ross et al’s analysis should not be taken as significant evidence for the view that the police exhibit an anti-black bias in who they unjustifiably kill.
Steffenmier et al. (2011) on Victimization Surveys
Traditionally, the UCR has not separated Hispanics from whites. This meant that you could compare the percentage of people arrested for a crime who were black to the percentage of offenders who were black but you could not compare the black-white gap in arrest rates to the black-white gap in offender rates. Doing so would ignore the fact that Hispanics would likely be lumped in with whites.
Steffenmeier et al. (2011) attempted to “clean” the statistics so as to separate Hispanics from whites and allow us to not just compare the percent of black offenders in the NCVS and the UCR, but also the ratio of white to black offenders. However, their methodology relied on the assumption that the gap in criminality between whites and hispanics in New York and California is representative of the gap nationally. This assumption is false and no evidence is provided for its validity. The national ratio of white to hispanic incarceration is 1.4 while it is 1.9 in CA and 3.1 in NY (Nellis, 2021). For this reason, we should not accept Steffenmeier et al’s “clean” rates as valid. Without applying this cleaning approach, the data shows a gap between racial inequality across the NCVS and UCR in the 1980s but convergence by the 2000s.
So this paper does not justify thinking that there is racial bias in contemporary arrest rates.
69 thoughts on “American Racism and the Anti-White Left”
Your rebuttal to “black applicants received 36% fewer call backs than white applicants” was confusing. It seemed like you were making the same point Ryan made in his old video “White Privileged: Employment Opportunity”, but you went too fast.
I think the best way to explain this is by giving an opposite example… suppose we could only apply for a basketball teams via a resume. A white guy and a black guy both write that they’re 6’2″ and have 4 years of highschool experience. Since their resumes are identical, should we assume that they’re equally skilled at basketball? Suppose that studies showed that controlling for height and highschool experience, blacks perform better at basketball… we’d expect basketball teams to choose the black applicant more often.
This phenomenon doesn’t mean that one group performs better than another on average… it’s possible that one group has higher average resume qualifications despite having the same average performance.
I actually understood his explanation like this: Since blacks get preferential treatment for things such as college/university admissions, it is easier for a black person to get a degree from a particular university than it is for a white person to do so. For instance, a 115 IQ black person (possible example: Michelle Obama) could realistically go to the Ivy Leagues whereas this is probably unlikely for a 115 IQ white person. So, it could make sense for companies to conclude that, statistically speaking, even when blacks and whites have equal qualifications, the black person might have been a beneficiary of affirmative action whereas the white person wasn’t. Of course, this is unfair to black people who genuinely would have still had the same qualifications even without affirmative action–which simply points out a way as to how affirmative action can harm extremely smart blacks who can survive in a meritocracy without too much problems.
Using Michelle Obama as a “possible example” of a 115 IQ is extremely dubious. She is NOT a smart woman, even for a negro. In fact, she, herself, admitted that she “never tested well” when asked about her grades, and how she was able to get into, so called, “prestigious universities”. Of course she never admitted that her skin color was the only reason she got in..
I like your analogy but you don’t need to get abstract to btfo “blacks aren’t called back for jobs” study. You can btfo it pleb-brained with ‘facts & logic.’
The study was conducted over three times, as to why the researchers through out their first two attempts the authors never explained (presumably it didn’t give them the results they wanted)
The authors of the study chose the black & white names by census data, choosing the most popular black & white names.
Black men had much more normal names like Maurice (a French name) as opposed to the most common black women names which included many more made up ebonic names. It’s been about ten years since I tore this study apart for a school project so double check the exact names but the black women included many made-up American black names, which are harder to pronounce and denote low status.
Black women and white women had a greater gap in call backs than black men vs white men.
HOWEVER many white names dramatically under performed in call backs. The authors did have the integrity to include the call back rate by name, and while ‘Sarahs’ received a very high call back rate ‘Emilys’ did not. On top of that black women with the name ‘Ebony’ outperformed many of the white women names.
If the discrimination was upon racial lines why was the black female name the literally means black (ebony!) the most called back???
Not all of the black female names were LeKeisha’s and Ebony’s, why would RACISTS chose the blackest sounding name over the bottom half of the most common white women names?
If the employers were racist against blacks it would seem like eliminating Ebony’s from your applicants stack would be the first place you’d start? No?
Why would Ebony’s applications be so favored over extremely white names like Emily & Becky, if the employers were discriminating against blacks?
All you have to do to btfo the discrimination in call back’s study is to pull up the names from the study and report their call back rate. It varies wildly between the names with ebony winning as the most called back black female name, beating out the bottom half of white names.
In other words the study is complete horse shit and by no means shows racial bias. And the authors never bothered to explain why they didn’t release the results of their first two attempts and why Ebony would be at the top of the list for black women call backs.
“some white people may need to die so that Black people can get what they deserve.”
Ain’t that the truth. A *lot* of white people need to die, possibly millions, before the survivors realize that black people deserve free transportation back to Africa.
So, should I be suspicious of the fact that you seem to be totally anonymous here? It just seems that someone who doesn’t stand by their convictions in public can’t really be trusted.
It could be because the people who blindly disagree with this article will flood him with hate and try to “cancel” him, go after his family and income and generally try to ruin life. It doesn’t matter how many facts and studies he uses SJW/idiots will throw tantrums because he hurt their delicate fee fees.
I am a Social Justice Warrior, and if you oppose my crusade for equality, I will doxx you out and destroy your life. You’ll lose your job, your professional licenses, your wife and kids, and all your friends.
If I cannot uncover your true identity, you’re an anonymous coward, an unemployed 40-year-old virgin micropenis living in your mother’s basement. Every story you tell is an anecdote you made up to support your racist, hateful right-wing ideas.
Woah! Who the fuck are you? Why do you think you have the right to say that statistics are wrong? I listen to everything you have to say if I want to investigate with somebody else puts up I have that right. Threatening this author just makes you look like a racist afraid of white people…
d a v e🤣
Cool analysis to read. Everyone’s a victim: i could easily point out how annoying it is for all blacks to be blasted with ‘Differences in IQ across races’ studies – that their intelligence is ‘fixed’ and that they can’t do anything about it
Eric Kaufmann: The leftward shift in racial ideology has been led by white liberals, not minorities (who tend to be more centrist). https://nytimes.com/2019/03/18/opinion/race-america-trump.html
“The country is not divided by racial conflict, but by conflict over racial ideology.”
Self-hatred has always been a foundation of the radical left. It is enough to see the Marxist intellectuals hating the bourgeoisie when they themselves come from the bourgeoisie, the anti-imperialism of the radical left (which bizarrely criticizes imperialism only when it is American but has no problem with when it comes from the USSR or Russia today).
Many far-left intellectuals were of Jewish origin, but that did not stop them from being anti-Semites.
Many ecologists hate the human species which they see as responsible for all evils and as harmful to nature. (Environmentalists deify nature).
It is not for nothing that in Europe, we are witnessing an alliance between the left and the Islamists. Both are motivated by this same hatred for the West. That the Islamists hate the West I want to understand (even if it does not make sense to immigrate to Europe if you do not like Westerners) but that the left hates the West, I cannot explain it .
The perspective that dismisses criticism of Western influence as mere “hatred of the west” oversimplifies the complexities underlying global issues. The question of why individuals migrate from their home countries to the West cannot be adequately addressed without acknowledging the historical impact of imperialism and colonialism.
Imperialistic practices, resource exploitation, and support for corrupt regimes have left many nations in economic turmoil. When democratically elected leaders attempt to nationalize resources or establish independent currencies, they often face opposition by the west, are labeled “terrorists,” to justify coups or assassination attempts. This historical context highlights the systemic issues that drive people away from their homelands.
Furthermore, in Europe, there’s a need to explore the seemingly incongruent alignment of Muslims with leftist ideologies. Islamophobia, fueled by European supremacists, plays a role in fostering this alignment. By critically examining the broader geopolitical landscape, we can understand that some of today’s challenges stem from a history of imperialism.
The essay also suggests that the political spectrum is a false dichotomy. Both left and right, despite apparent differences, often serve the interests of powerful corporations. These entities prioritize financial gain over the well-being of individuals, undermining the ideals professed by both political extremes.
The demonization of Islam in the West is not solely rooted in concerns about terrorism; it also involves economic factors. Islam’s prohibition of usury conflicts with major industries in the West, such as gambling, drinking, pornography, and drugs. The refusal to acknowledge these economic disparities contributes to the failure of societies as leaders prioritize corporate interests over the genuine needs of their citizens.
Here are some books you can read to understand the current state of the world.
Imperialism and Colonialism:
“Imperialism: A Study” by J.A. Hobson
“Orientalism” by Edward Said
“A People’s History of the United States” by Howard Zinn
Resource Exploitation and Corruption:
“Confessions of an Economic Hitman” by John Perkins
“The Looting Machine: Warlords, Tycoons, Smugglers, and the Systematic Theft of Africa’s Wealth” by Tom Burgis
Islamophobia and Global Politics:
“Islamophobia: The Ideological Campaign Against Muslims” by Stephen Sheehi
“Who Speaks for Islam?: What a Billion Muslims Really Think” by John L. Esposito and Dalia Mogahed
Political Economy and Corporations:
“Capital in the Twenty-First Century” by Thomas Piketty
“Manufacturing Consent: The Political Economy of the Mass Media” by Edward S. Herman and Noam Chomsky
Usury and Economic Impact:
“Islamic Banking and Finance: What It Is and What It Could Be” by Tariq Alrifai
“Interest and the Islamic Economy: History and Policy” by Seif I. Tag el-Din
the subject of race is too often handled in cartoonish low resolution terms,often for bias confirmative ends.
the term race is rarely defined and often conflated with tribe , nation or culture .
when race is defined , often it’s by color which is more low resolution thinking when it should be by ETHNICITY , because Caucasian for example range from Nordic to Central Asian to Latino, same for blacks and Asians. all this conflation and generalization is nonconductive towards intelligent honest dialogue and serves to shut down free speech and drive people further into tribalism , a divide and conquer strategy of Marxism.
Study shows that Libs support censorship when women, Islam or blacks are portrayed negatively.
But Libs have no prob when it comes to portraying men, Christianity or whites negatively.
Libs call it intersectionality… everyone else calls it hypocrisy. https://www.researchgate.net/publication/333677484_The_Ideology_of_Censorship
Huge meta-analysis finds (92 studies, 87,416 people) finds that changes in implicit associations does not predict actual racist behavior or explicit associations. In addition, they tested for publication bias and found an ant-hereditarian publication bias.
Whites high on an anti-Hispanic modern racism-type measure favored Whites over Hispanics. But Whites low on the measure favored Hispanics over Whites. https://www.ljzigerell.com/?p=7823
“For instance, a 2017 report on all the companies in the S&P 100 found over 90% of them had engaged in diversity initiatives and 75% of them had gone as far as setting specific hiring targets for minority employment. The same report found that such practices are rapidly gaining in popularity.”
The report you linked in the above paragraph has been deleted from that website and also not archived either on web archive, archive.today or Google Cache.
In England, authorities deliberately let Pakistani Muslims rape tens of thousands of white girls in Rochdale, Rotherham, Telford,
Derby, Oxford, Newcastle, Halifax, Keighley and Huddersfiel for fear of stirring up racism.
Anti-racism is letting white girls be raped.
and the worst part is that the attackers were sentenced to ridiculous sentences. An attacker like Mubarek Ali spent 14 months in prison. Robinson, a far-right journalist who covered the scandal spent 13 months in jail for covering up the court’s confidentiality order by revealing details of the case. So a juvenile rapist spends almost as much time in prison as a journalist who notes the details of the case.
What all these gangs of rapists have in common is that they are mostly Pakistanis and Indians. And absolutely all the aggressors are Muslims. They rape these girls because they are non-Muslims.
These are white girls who come from popular backgrounds. The authorities have shown incredible contempt for them. They have deliberately closed their eyes so as not to penalize the Asian community (be careful in England, the term Asians mean Pakistanis, Bangladeshis and Indians. It is different from Asians in the United States who mainly refer to the people of East Asia as the Chinese or Korean).
“And those same minorities don’t give a damn if you’re a victim of minority violence”
And those same authorities don’t give a fuck if you are a victim of violence from minorities.
Deliberate Allowance of Crimes: The assertion that authorities in England deliberately allowed crimes to occur is a serious accusation. It’s important to note that investigations into cases of child exploitation have revealed failures in handling these cases, but attributing these issues to deliberate actions to avoid stirring racism requires careful evidence and analysis.
Religious Motivation for Crimes: Linking the crimes solely to the religious background of the perpetrators oversimplifies a complex issue. Criminal behavior is multifaceted, and motivations can vary. It is incorrect to assert that all attackers are Muslims or that they commit crimes based on religious beliefs. Such generalizations can contribute to misunderstanding and bias.
Sentencing Disparities: The comparison between the sentences of a juvenile rapist and a journalist is presented without adequate context. Legal decisions are complex and depend on various factors, including the specifics of each case. A nuanced analysis is necessary before concluding that these sentences reflect a systemic issue.
Contempt for Poor Whites: The claim that English authorities have deep contempt for poor whites lacks substantial evidence. Socioeconomic disparities are complex, and attributing them solely to contempt from authorities oversimplifies the root causes of such issues.
University Admission Disparities: While the links provided discuss disparities in university admissions, the reasons behind these disparities are multifaceted and cannot be solely attributed to racial or ethnic factors. Socioeconomic status, educational opportunities, and other systemic factors contribute to these disparities.
Minority Violence: Asserting that minorities don’t care about violence against poor whites oversimplifies inter-community dynamics. It’s essential to avoid generalizations and recognize that individuals within any community may have diverse perspectives.
Engaging in nuanced, evidence-based discussions is crucial when addressing complex issues. Misinformation and broad generalizations can hinder meaningful dialogue and perpetuate stereotypes. It’s important to rely on verified information and encourage a more comprehensive understanding of the factors contributing to these challenges.
“This page wasn’t found
Unfortunately, the page you were looking for at this address doesn’t seem to exist.
It could be that the link is incorrectly typed or out of date.” It seems your source doesn’t exist anymore, lol. Let’s address the point. The claim that “the Left is rewriting American history to portray whites as bad guys” is a broad statement and warrants a nuanced analysis. Let’s break it down:
Diversity of Perspectives in History:
Critique: Historical narratives have evolved over time to include more diverse perspectives, reflecting the experiences of marginalized communities that may have been previously neglected.
Consideration: A more inclusive approach to history seeks to present a well-rounded view of the past, acknowledging both positive and negative aspects of various groups’ actions.
Addressing systemic issues:
Critique: The claim implies a deliberate effort to portray whites negatively. In reality, many historical discussions focus on systemic issues, such as racism and inequality, to better understand their origins and impact.
Consideration: Recognizing historical injustices and their consequences doesn’t necessarily mean assigning blame to an entire racial or ethnic group. The goal may be to learn from the past and work towards a more just society.
Historical Revisionism:
Critique: The term “rewriting history” often implies a negative connotation of deliberate distortion. Historical scholarship evolves as new research emerges, challenging previously accepted narratives. This process is not inherently negative but rather a part of the academic pursuit of truth.
Consideration: Constant reevaluation of historical accounts is essential for a more accurate understanding of the past. It’s important to distinguish between evidence-based revisions and intentional distortions.
Promoting Critical Thinking:
Critique: Accusing the Left of solely rewriting history oversimplifies the complex nature of historical scholarship. Different individuals and groups contribute to historical discussions, and perspectives may vary.
Consideration: Encouraging critical thinking and multiple viewpoints in historical education allows for a more comprehensive understanding of the past. Constructive dialogue should be promoted to navigate differing interpretations.
In conclusion, discussions about the portrayal of history should be approached with an understanding of the complexities involved. While there may be ongoing debates about how to interpret historical events, it’s essential to consider the intention behind historical discussions and promote an inclusive and accurate representation of the past.
Evidence for publication bias in correspondence studies of ethnic discrimination in the supp materials of this paper. White dots indicate “missing studies” (which are concentrated toward the result of less or no discrimination). Authors are “surprised” https://www.tandfonline.com/doi/abs/10.1080/1369183X.2015.1133279
1 fascinating study Klein quotes found that “priming white college students to think about the concept of white privilege led them to express more racial resentment in subsequent surveys.” Anti-racist indoctrination actually feeds racism—tribalism deepens https://nymag.com/intelligencer/2020/01/andrew-sullivan-america-needs-a-miracle.html
Reading white privilege does not make people more concerned about the plight of poor black people; it just makes them less concerned about the plight of poor whites. https://psycnet.apa.org/record/2019-22926-001
This article brings up some interesting things: https://freddiedeboer.substack.com/p/people-of-color-have-agency
The anti-racist left is in a way racist. By making whites the absolute evil and responsible for all the ills of blacks (and other racialized people), they completely infantilize these blacks. And in a way, it’s extremely pretentious and egotistical to say that it’s all about white people. To say that whites are responsible for all evil is to turn whites into some sort of superior race capable of totally controlling other races. The anti-racist left makes black victims incapable of acting on their own.
When you deny the moral responsibility of black criminals and claim that you have to accept what they do on the pretext that they are black. In the end you just insult other black people who respect the law.
Interestingly, Democrats are promoting affirmative action especially in schools and universities on the premise that POCs cannot feel comfortable with white teachers. But isn’t that literally racist by LW standards? What would a progressive say if a white person said, “I can’t feel comfortable because too many of my teachers are black”?
The Theory of Intersectionality elevates the insights, such as they are, of individuals with lower average IQ and less interest in logic. This isn’t JK Galbraith vs. WF Buckley anymore, this is now black women diversicrats talking about their lived experience of hair-touching.
So, our “intellectual” discourse is evermore based on the assumption that certain people (e.g., blacks, transgenders) are morally better than other people (whites, men, straights, etc).
Hence, the Good people deserve the money and prestige of the Bad people, who deserve pain.
Therefore, there are no longer any such thing as racist actions that members of any race could be guilty of, there are only racist people that only members of the white race can be guilty of. Moreover, whites deserve to be discriminated against because they are the Bad people.
The hypocrisy of anti-racists is obvious. They are interested in fighting only certain racisms. They have no problem with anti-white racism.
I even see a change in anti-Semitism. (In Europe, the left has long had a problem with anti-Semitism. Except when it helps to fight the far right. They will fight against anti-Semitism when it comes from evil white extremists. right. But when it is Muslims who attack the Jews, they are silent).
In the US, due to the influence of Jews in the Democratic Party, the left has tended to be more against anti-Semitism. But that is about to change. This is especially true for the left wing of the Democratic Party (which is extremely complacent with anti-Semitism).
(Just look at what happened in 2021 during the conflict between Israel and Hamas. The same people (AOC, Omar, … ° who claim racist to talk about ALL Lives Matters have produced statements to say that ‘they condemned anti-Semitism and Islamophobia “. While there was no Islamophobic incident during this period, only anti-Semitic incidents. In short, condemn Islamophobia when the only incidents recorded are anti-Semitic attacks made by Muslims: this sounds like the minimization of anti-Semitism)
How can you be against anti-Semitism and in favor of Islam ??? The majority of Muslims in this world are anti-Semites. https://www.pewresearch.org/global/2010/02/04/chapter-3-views-of-religious-groups/?utm_source=pocket_mylist
You just have to see what is happening in Europe. Because of Muslim immigration, Jews are in danger. They cannot live in cities where there are a lot of Muslims. The Seine Saint Denis in France was cleansed of Jews because this place has a large Muslim community. In short, I do not see how you can at the same time be favorable to Islam and be against anti-Semitism. There comes a time when you have to choose between Muslims (especially if they’re Arabs) and Jews. The European left has long chosen to prefer Muslim Arabs to Jews. In the US, the problem is less severe. There are fewer Muslims. And these are immigrants strongly selected to be the elite of their countries (they are more educated and more secular. So probably less anti-Semitic than normal Muslims). Still, clearly you can see that the problem is happening.
Just look at what happened with the anti-Asian attacks in the US. On the one hand, the left wants to fight against anti-Asian racism, but on the other hand, the left doesn’t want to acknowledge the fact that these attacks are overwhelmingly from blacks. They talk about fighting the epidemic of anti-Asian racist assaults without ever pointing out that 95% of these assaults come from black people. In other words, they will never solve the problem. How do you solve the problem of assaults if you don’t admit that the assaults are coming from black people? In the US, there is a rule: when the media reports on a racist incident without mentioning the ethnicity of the person who committed the racist incident, it is almost certain that this person is a non-white and a POC. On the other hand, if a white person commits a racist act, the media will always specify that they are white.
This reminds me of the European left that wants to fight against street harassment but does not want to recognize that this harassment is done by African or Arab immigrants. They just blame the patriarchal society.
Some anti-racists have claimed that anti-Asian assaults are the work of white supremacy even if the assailants are black. This shows how white supremacy has become the ultimate evil of the American left. The left lends white supremacy magical powers. For leftists, white supremacy is responsible for all evil.
In short, the fight against racism according to anti-racists is really more a form of tribalism to benefit certain groups over others. In the US, the black ethnic group is sacred to anti-racists. Any form of action against blacks is considered racist in the US by the left. Then it’s Latinos. And finally, Asians. There is clearly a hierarchy of ethnicities. Whites being the absolute evil, blacks the absolute good. If there is an Asian/black conflict (as in the case of affirmative action), anti-racists will always prefer blacks to Asians. Very often, if you look at anti-racists, you see that what they condemn as racist would not be a problem in a situation where it involved another ethnic group.
Anti-racism has a conflicting view of ethnic group relations. The goal is to empower some groups over others. The goal of the left is never to fight oppression but to reverse it. They want white people to be discriminated against and oppressed just like men or heterosexuals.
Anti-racism has a conflicting view of ethnic group relations. The goal is to empower some groups over others. The left’s goal of fighting oppression is not to end it but to reverse it. Let those who were the oppressors become the oppressed. They want white people to be discriminated against and oppressed like men or heterosexuals.
Anti-racism varies by ethnicity. It depends on both the ethnicity of the victim and the ethnicity of the perpetrator. For example, a white person will never be a victim of racism according to anti-racists. On the other hand, an Asian person will be a victim of racism, but will be more likely to be recognized as a victim of racism if the perpetrator is white than black. Anti-racists are much more reluctant to recognize racism if it comes from a black person. Of course, if the black person is conservative, that person will be less protected from charges of racism.
In general, when it becomes impossible to deny a racist act by a black person, anti-racists will condemn the racist act but will go out of their way to avoid specifying the ethnicity of the perpetrator.
Anti-racists assume that white people are racist simply because they are white. If that’s not a racist presupposition, I don’t know what is.
Antiracists talk about fighting racist stereotypes, but the funny thing is that what they consider racist stereotypes is anything that goes against their ideological worldview. Basically, fighting against racist stereotypes is like accepting the ideology of anti-racists (of course, they never bring any evidence to justify their claims. They want people to accept what they say uncritically). Oddly enough, the people who fight against racist stereotypes seem to have many ideological stereotypes (and don’t seem to see the problem with having such stereotypes).
Let’s just say that their worldview is based on a lot of assumptions that seem rather dubious.
I think leftists are genuinely miserable people at heart. They struggle with constant disappointment that the world doesn’t live up to their ideal standards. This makes them bitter, angry, and unable to experience joy unless it comes at the expense of those they oppose.
Facebook’s algorithm was problematic because it treated expressions of hatred for whites and men same as for other groups. It therefore had a “disparate impact” against minorities, which it should’ve revealed to “civil rights leaders.” https://www.washingtonpost.com/technology/2021/11/21/facebook-algorithm-biased-race/
Facebook rejected a plan to treat speech directed against people who were “Black, Jewish, LGBTQ, Muslim or of multiple races” more harshly, another sign of their “racism.” They finally agreed though to stop automatically taking down criticisms of whites, Americans and men.
WASHINGTON POST: Facebook’s Algorithms Found That Most Hate Speech On Facebook Was Anti-White And/or Anti-Male, But That’s GOOD Hate Speech. The Washington Post article shows how deeply racist anti-racists are.
It’s weird that BLM guys only get upset about the death of blacks when they are killed by whites or cops (even when, by the way, it’s self-defense and the black is the aggressor). The vast majority of murders of blacks are committed by blacks but the anti-racists don’t care because they want to spit on the police and on whites.
What evidence is there that the police officer who killed Floyd was racist? None. Yet they assumed he was a racist simply because he was a white police officer. This illustrates their own racism. If you assume someone is racist simply because of their skin color you are racist.
America is a land where teachers are on the hunt for blond students to punish to get their numbers up. Where the gov might notice you didn’t punish all races equally, so your small school district has to be buried in tens of thousands of pages of paperwork

 Similarly, Dupree et al. (2019) found that: “Across five experiments (total N = 2,157), White participants responded to a Black or White interaction partner… liberals—but not conservatives—presented less competence to Black interaction partners than to White ones… This possibly unintentional but ultimately patronizing competence downshift suggests that well-intentioned liberal Whites may draw on low-status/competence stereotypes to affiliate with minorities”. In other words, white liberals talk to black people like they’re children.
This may also explain why it is that leftists spend a great deal more time talking about white on black murder than they do on black on black murder even though the later is far more common.
Similarly, Dupree et al. (2019) found that: “Across five experiments (total N = 2,157), White participants responded to a Black or White interaction partner… liberals—but not conservatives—presented less competence to Black interaction partners than to White ones… This possibly unintentional but ultimately patronizing competence downshift suggests that well-intentioned liberal Whites may draw on low-status/competence stereotypes to affiliate with minorities”. In other words, white liberals talk to black people like they’re children.
This may also explain why it is that leftists spend a great deal more time talking about white on black murder than they do on black on black murder even though the later is far more common.
 Intuitively, we might suspect that this kind of thing, what is often called “white guilt”, may be psychologically damaging. This intuition is supported by Fujushiro (2009) who found that thinking your race is given an unfair advantage doubled a person’s risk of poor mental health even after controlling for age, sex, education, income, and marital status.
 There’s also research showing that white guilt has increased with time, and that leftist ideology has a causal impact on white guilt.
So far as I can tell, research estimating the average degree of racial guilt among white college kids began in the 1970s (Bardis, 1973). Guilt was measured with questions like “Do you feel personally guilty about the American Negro’s present social inequality?”.
There’s also research showing that white guilt has increased with time, and that leftist ideology has a causal impact on white guilt.
So far as I can tell, research estimating the average degree of racial guilt among white college kids began in the 1970s (Bardis, 1973). Guilt was measured with questions like “Do you feel personally guilty about the American Negro’s present social inequality?”.
 Back then, on a 5-point scale ranging from completely disagree to completely agree, whites averaged a score of less than 2 on most questions.
So far as I know, another paper quantifying white guilt wasn’t published until 1999 (Swim and Miller., 1999). Agreement with the same sorts of statements as before was rated on a 5 point scale, and the average response was 2.12, implying only slight guilt and that the mean level of guilt had not changed much since the 1970s. However, this slight guilt was pervasive with only 6% of the sample saying that they strongly disagreed with all five statements of guilt.
In 2007, this same scale was administered to another sample of white college kids (Case, 2007). This time, the mean response was 3.64. After these students took a diversity course, the mean score increased to 3.94, implying a good deal of guilt, and implying that leftism causes such guilt.
Back then, on a 5-point scale ranging from completely disagree to completely agree, whites averaged a score of less than 2 on most questions.
So far as I know, another paper quantifying white guilt wasn’t published until 1999 (Swim and Miller., 1999). Agreement with the same sorts of statements as before was rated on a 5 point scale, and the average response was 2.12, implying only slight guilt and that the mean level of guilt had not changed much since the 1970s. However, this slight guilt was pervasive with only 6% of the sample saying that they strongly disagreed with all five statements of guilt.
In 2007, this same scale was administered to another sample of white college kids (Case, 2007). This time, the mean response was 3.64. After these students took a diversity course, the mean score increased to 3.94, implying a good deal of guilt, and implying that leftism causes such guilt.
 Similarly, Powell et al. (2005) reported the following: “In Experiment 1 (N = 110), White American participants assessed 24 statements about racial inequality framed as either White privileges or Black disadvantages. In Experiment 2 (N = 122), White participants generated examples of White privileges or Black disadvantages. In both experiments, a White privilege framing resulted in greater collective guilt”.
Thus, over time white guilt is becoming more common and such guilt is caused by leftist rhetoric. We we’ve seen, this is potentially damaging to the mental health of the white people who internalize left wing narratives.
Such narratives are probably not only damaging to those who feel an active sense of white guilt. It is likely that they’ve also harmed white people who have responded to the modern political climate by simply de-identifying with their race or ethnic group. We have some reason to think that this is damaging, because, as can be seen below, identifying with one’s race is generally correlated with higher self-esteem and this is especially true of white people.
Similarly, Powell et al. (2005) reported the following: “In Experiment 1 (N = 110), White American participants assessed 24 statements about racial inequality framed as either White privileges or Black disadvantages. In Experiment 2 (N = 122), White participants generated examples of White privileges or Black disadvantages. In both experiments, a White privilege framing resulted in greater collective guilt”.
Thus, over time white guilt is becoming more common and such guilt is caused by leftist rhetoric. We we’ve seen, this is potentially damaging to the mental health of the white people who internalize left wing narratives.
Such narratives are probably not only damaging to those who feel an active sense of white guilt. It is likely that they’ve also harmed white people who have responded to the modern political climate by simply de-identifying with their race or ethnic group. We have some reason to think that this is damaging, because, as can be seen below, identifying with one’s race is generally correlated with higher self-esteem and this is especially true of white people.
 Thus, the anti-white bias of liberals and lack of ethnic identity on the part of white Americans is plausibly damaging their mental health.

 We might think that white people are lying and that they are more biased than these results would indicate. Another line of evidence less susceptible to lying involves experiments in which two groups of people are asked how they deal with various situations. For both groups the situations will be identical except for the race of someone involved. We can thus experimentally test people degree of racial bias. Doing so we we find that white american’s don’t exhibit a significant degree of racial bias while black Americans do (Zigerell, 2018).
 This data suggests that on average white people exhibit no racial bias. Of course, this does not mean that there are no racist white people. But the impact of such people is made up for by an equal effect from white people who are biased in favor of non-whites so that the net mean level of discrimination is zero.
Sometimes, white Americans are accused of racism for believing in stereotypes. In response to this it is useful to point out two things. First, fewer than one third of white Americans report thinking that black people are, for instance, less intelligent or hardworking than white people (Moberg et al., 2019).
Secondly, whether a stereotype is an example of unfair racial bias depends on whether it is true. In this very section I am arguing that thinking white people are racist is unfair and biased specifically because it is not true. By contrast, the negative stereotypes white people are accused of believing in with respect to black people are overwhelmingly supported by empirical evidence.
First, take intelligence. Meta-analyses of data on millions of participants show that black people score lower than white people do on intelligence tests (Roth et al., 2001).
This data suggests that on average white people exhibit no racial bias. Of course, this does not mean that there are no racist white people. But the impact of such people is made up for by an equal effect from white people who are biased in favor of non-whites so that the net mean level of discrimination is zero.
Sometimes, white Americans are accused of racism for believing in stereotypes. In response to this it is useful to point out two things. First, fewer than one third of white Americans report thinking that black people are, for instance, less intelligent or hardworking than white people (Moberg et al., 2019).
Secondly, whether a stereotype is an example of unfair racial bias depends on whether it is true. In this very section I am arguing that thinking white people are racist is unfair and biased specifically because it is not true. By contrast, the negative stereotypes white people are accused of believing in with respect to black people are overwhelmingly supported by empirical evidence.
First, take intelligence. Meta-analyses of data on millions of participants show that black people score lower than white people do on intelligence tests (Roth et al., 2001).
 And contrary to popular belief, most experts agree that such tests are not racially biased because they pass formal statistical tests for test bias (Reeve et al., 2008).
 Black Americans also score lower than white Americans on measures of emotional intelligence. In fact, on objective measures of emotional intelligence the black-white gap is roughly as large as the black-white gap in IQ (Joseph et al., 2010). Black people do score higher on self report measures of emotional intelligence, but this seems to be due to the already noted tendency of black people to think relatively highly of themselves rather than their actual degree of emotional intelligence.
 Black Americans also score lower than white Americans on measures of practical intelligence having to do with how to deal with real world situations (Whetzel et al., 2008).
 Given this, it seems obvious that someone could conclude that black people are, on average, less intelligent than white people without harboring any sort of race based hatred or bias. The same case could be made for hard work. Consider three facts:
First, black Americans are less likely than white Americans to have a job (Kiersz, 2015).
Given this, it seems obvious that someone could conclude that black people are, on average, less intelligent than white people without harboring any sort of race based hatred or bias. The same case could be made for hard work. Consider three facts:
First, black Americans are less likely than white Americans to have a job (Kiersz, 2015).
 Second, while at work black Americans spend more time than white Americans not working (Hamermest et al., 2017).
 Third, as children black Americans spend less time than white Americans doing homework (NCES, 2011)
 Thus, a simple look at the evidence seems to verify the idea that black people are, on average, less hardworking.
Connecting violence to black people is also sometimes called an unfair stereotype but it is well known, and documented later in this article, black people are way more likely than others to commit violent crime. Other sections of this article also document that black people spend more on luxury goods than do white people, save less after controlling for income, and generally have a higher view of themselves.
Stating these things may come off as racist, but it should be considered no more racist than accusing white people of racism is. More importantly, these statements are true. The fact that most white people today do not believe these stereotypes, or at least pretend not to, speaks to them conforming to an ideology which is biased in favor of non-white people.
Sometimes it is argued that we can show most white Americans are racially biased by appealing to the results of implicit association tests which are supposed to measure subconscious biases which people may be totally unaware of. However, IAT scores don’t predict actual racist behavior and so are not a valid measure of racial bias (Carlsson et al., 2016).
Thus, a simple look at the evidence seems to verify the idea that black people are, on average, less hardworking.
Connecting violence to black people is also sometimes called an unfair stereotype but it is well known, and documented later in this article, black people are way more likely than others to commit violent crime. Other sections of this article also document that black people spend more on luxury goods than do white people, save less after controlling for income, and generally have a higher view of themselves.
Stating these things may come off as racist, but it should be considered no more racist than accusing white people of racism is. More importantly, these statements are true. The fact that most white people today do not believe these stereotypes, or at least pretend not to, speaks to them conforming to an ideology which is biased in favor of non-white people.
Sometimes it is argued that we can show most white Americans are racially biased by appealing to the results of implicit association tests which are supposed to measure subconscious biases which people may be totally unaware of. However, IAT scores don’t predict actual racist behavior and so are not a valid measure of racial bias (Carlsson et al., 2016).
 In conclusion, using valid measures of racial bias reveals that minorities and liberal whites are racially biased either in favor of minorities or at least against white people. By contrast, the average white person exhibits no significant racial bias.

 Similarly, it has been shown that people are willing to pay 3.5% more for a book when they are led to think that books author is black suggesting that when comparing authors of equal talent black authors likely have a higher income (Weinberg et al., 2022).
Of course, racism may explain a group difference in one of these confounding variables, such as educational attainment, but it is important to note that group differences in income disappear or flip direction without directly controlling for any measure of racism.
Similarly, it has been shown that people are willing to pay 3.5% more for a book when they are led to think that books author is black suggesting that when comparing authors of equal talent black authors likely have a higher income (Weinberg et al., 2022).
Of course, racism may explain a group difference in one of these confounding variables, such as educational attainment, but it is important to note that group differences in income disappear or flip direction without directly controlling for any measure of racism.
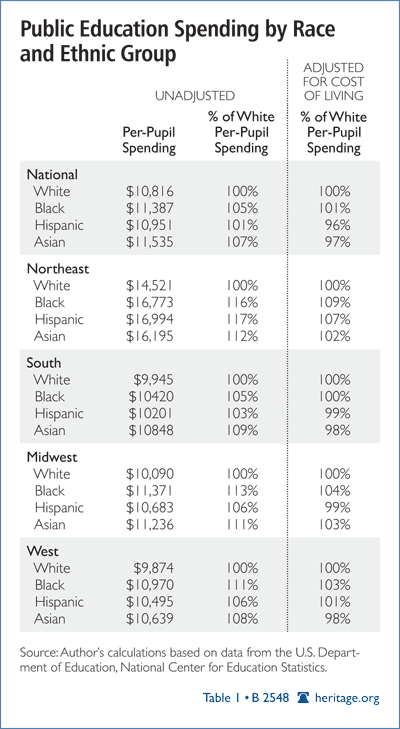 These difference in spending are reflected in school characteristics: on average, blacker schools have smaller classes more experienced teachers who have more formal education and who receive more pay (Cocoran et al., 2003).
This information may surprise some people as leftists often cite data showing that blacker school districts receive less funding than average. This is true but within school districts blacker schools receive more money and thus black students go to better funded schools than white students despite the headlines people sometimes see concerning district level disparities (Ejdemyr et al., 2017).
Once high-school is complete, students apply to college. Based on aggregated data from 20 previous studies, we can estimate that when comparing people of equal qualifications, Black applicants are roughly 21 times more likely than white applicants to be admitted, while Hispanics are 3 times as likely, and Asians are 6% less likely or 59% more likely depending on whether we use the mean or median estimate.
(The race columns show the odds of admission compared to those of white applicants when qualifications are held constant.)
These difference in spending are reflected in school characteristics: on average, blacker schools have smaller classes more experienced teachers who have more formal education and who receive more pay (Cocoran et al., 2003).
This information may surprise some people as leftists often cite data showing that blacker school districts receive less funding than average. This is true but within school districts blacker schools receive more money and thus black students go to better funded schools than white students despite the headlines people sometimes see concerning district level disparities (Ejdemyr et al., 2017).
Once high-school is complete, students apply to college. Based on aggregated data from 20 previous studies, we can estimate that when comparing people of equal qualifications, Black applicants are roughly 21 times more likely than white applicants to be admitted, while Hispanics are 3 times as likely, and Asians are 6% less likely or 59% more likely depending on whether we use the mean or median estimate.
(The race columns show the odds of admission compared to those of white applicants when qualifications are held constant.)
 And once in college non-white students are more likely to receive grants and scholarships despite the fact that white students are no more likely to have their parents pay for their school (Kantrowitz, 2011; Brown, 2019)
 As a whole then, resource allocation within the education system favors non-whites students over white ones. Obviously then, white racists have not inhibited black economic success by depriving them of the resources needed for educational success.
 In fact, since the early 1990s it has been true that most US firms with 100 or more employees have some sort of affirmative action policy (Dobbin et al. 2006).
 The idea that racism explains group differences in employment levels is also hard to square with the fact that there was no unemployment gap between races in the early 20th century when white people were far more likely to be racially biased against black people.
  It’s worth noting that the unemployment gap between races that emerged in the second half of the 20th century seems to be, at least in part, voluntary. As Williams (2011) reports: “During 1979-1980, the National Bureau of Economic Research conducted a survey in the ghettos of Boston, Philadelphia, and Chicago. Only a minority of the respondents were employed, yet almost as many said it was easy or fairly easy to get a job as a laborer as said it was difficult or impossible; and 71 percent said it was fairly easy to get a minimum-wage job.”
If you tell this to a leftist, they are likely to respond by noting that black people are less likely than white people to get called back when they submit a job application that is identical in every way other than the race implied by their name. To be specific, Quillian et al. (2017) meta-analyzed the research on hiring discrimination and found that black applicants received 36% fewer call backs than white applicants. So this effect isn’t very large even if it is explained by racism.
But it’s probably not. These sorts of experiments rely on a basic misunderstanding of how qualifications relate to job performance. Suppose that the distributions of job performance among blacks and whites consist of two overlapping normal distributions, like this:
It’s worth noting that the unemployment gap between races that emerged in the second half of the 20th century seems to be, at least in part, voluntary. As Williams (2011) reports: “During 1979-1980, the National Bureau of Economic Research conducted a survey in the ghettos of Boston, Philadelphia, and Chicago. Only a minority of the respondents were employed, yet almost as many said it was easy or fairly easy to get a job as a laborer as said it was difficult or impossible; and 71 percent said it was fairly easy to get a minimum-wage job.”
If you tell this to a leftist, they are likely to respond by noting that black people are less likely than white people to get called back when they submit a job application that is identical in every way other than the race implied by their name. To be specific, Quillian et al. (2017) meta-analyzed the research on hiring discrimination and found that black applicants received 36% fewer call backs than white applicants. So this effect isn’t very large even if it is explained by racism.
But it’s probably not. These sorts of experiments rely on a basic misunderstanding of how qualifications relate to job performance. Suppose that the distributions of job performance among blacks and whites consist of two overlapping normal distributions, like this:
 Now suppose that qualifications on a resume require a certain level of skill and ability to obtain such that those who would be bad employees cannot easily acquire them. As is hopefully evident in the below example, there is no possible threshold for job performance, or any other relevant trait (e.g. job related knowledge, cognitive ability, self discipline, etc.,) where the white mean is above the black mean in general, but not still above the black mean among those who exceed that threshold.
 This becomes even more true if we make it easier for black people to acquire a given qualification than it is for a white person. In this scenario, among applicants with any such qualifications, white job performance will exceed black people’s job performance among those with equal qualification even if there is no mean difference in job performance between black and white people in the total population.
 This situation is exactly what happens when a society institutes affirmative action and as we’ve seen affirmative action for African Americans is widespread in contemporary America.
These theoretical considerations should be sufficient to show that these experiments are invalid measures of racism, but if you’d like empirical evidence to substantiate this consider the results of a massive study carried out by the federal government to measure people’s work-related cognitive abilities in terms of things like everyday math skills, writing skills, and the ability to efficiently use information taken from a document.
This situation is exactly what happens when a society institutes affirmative action and as we’ve seen affirmative action for African Americans is widespread in contemporary America.
These theoretical considerations should be sufficient to show that these experiments are invalid measures of racism, but if you’d like empirical evidence to substantiate this consider the results of a massive study carried out by the federal government to measure people’s work-related cognitive abilities in terms of things like everyday math skills, writing skills, and the ability to efficiently use information taken from a document.


 As can be seen, the general trend was such that black respondents were outscored by white respondents who had lower levels of education attainment than the black respondents did.
Similar results are found in Neill (1990), a paper which shows the mean AFQT percentile scores of black and white men aged 19-21 by education level for the years 1953-1958 and 1980. (The AFQT is a test designed by the military to measure cognitive skills relevant to job performance such as reasoning ability, mathematical ability, and reading ability.)
As can be seen, the general trend was such that black respondents were outscored by white respondents who had lower levels of education attainment than the black respondents did.
Similar results are found in Neill (1990), a paper which shows the mean AFQT percentile scores of black and white men aged 19-21 by education level for the years 1953-1958 and 1980. (The AFQT is a test designed by the military to measure cognitive skills relevant to job performance such as reasoning ability, mathematical ability, and reading ability.)
 In 1980, Black people who had completed 3-4 years of college came in, on average, at the 49.7th percentile, or slightly below the average score unconditional on education. By contrast, the average percentile scores were 80.2 for whites with 3-4 years of college, 65.8 for whites with 1-2 years of college, and 46.5 for whites with 3-4 years of high school. This was even more extreme in the 50s, when black people with 3-4 years of college completed scored lower than whites with 3-4 years of high school.
Similar disparities are seen within occupations, with white people significantly out scoring black and Hispanic people on IQ tests when comparing people within the same industries (Murray, 2021).
In 1980, Black people who had completed 3-4 years of college came in, on average, at the 49.7th percentile, or slightly below the average score unconditional on education. By contrast, the average percentile scores were 80.2 for whites with 3-4 years of college, 65.8 for whites with 1-2 years of college, and 46.5 for whites with 3-4 years of high school. This was even more extreme in the 50s, when black people with 3-4 years of college completed scored lower than whites with 3-4 years of high school.
Similar disparities are seen within occupations, with white people significantly out scoring black and Hispanic people on IQ tests when comparing people within the same industries (Murray, 2021).
 Thus, it is clearly rational for employers to prefer the average white applicant over the average black applicant even if they are the same on paper in terms of things like work experience and educational attainment.
Ideally, we’d want to test this by comparing the rate at which black and white applicants are hired after controlling for the qualifications that show up on a resume as well as direct measures of the job performance related abilities that are not directly captured on a resume. To my knowledge, the only paper to do this is Ho (2005) who found that race did not predict whether an applicant was hired once such variables were controlled for.
Thus, it is clearly rational for employers to prefer the average white applicant over the average black applicant even if they are the same on paper in terms of things like work experience and educational attainment.
Ideally, we’d want to test this by comparing the rate at which black and white applicants are hired after controlling for the qualifications that show up on a resume as well as direct measures of the job performance related abilities that are not directly captured on a resume. To my knowledge, the only paper to do this is Ho (2005) who found that race did not predict whether an applicant was hired once such variables were controlled for.
 The most important evidence on this question comes from Roth et al. (2003) who meta-analyzed data from 19 previous studies and found that black employees scored 0.30 standard deviations lower than white employees on measures of job performance even when they were working the same job at the same organization. This suggests that what is being required of applicants in terms of actual job performance, rather than on paper qualifications, is lesser for minorities.
This is consistent with most firms engaging in affirmative action in hiring and, because they are invalid measures of racial bias, this is also consistent with black applicants receiving 36% fewer call backs on applications.
Some might argue that this explanation is rude, racist even, because it requires that we note the job performance gap between black and white people. Here I would re-iterate that it is no less rude or racist to blame this difference on the supposed immoral behavior of white people. The only reason I’ve even brought this up is to defend white people against this charge. We can also note that, obviously, a group difference in averages is just that, a difference in averages, and there are individuals of all types in every racial group.
The most important evidence on this question comes from Roth et al. (2003) who meta-analyzed data from 19 previous studies and found that black employees scored 0.30 standard deviations lower than white employees on measures of job performance even when they were working the same job at the same organization. This suggests that what is being required of applicants in terms of actual job performance, rather than on paper qualifications, is lesser for minorities.
This is consistent with most firms engaging in affirmative action in hiring and, because they are invalid measures of racial bias, this is also consistent with black applicants receiving 36% fewer call backs on applications.
Some might argue that this explanation is rude, racist even, because it requires that we note the job performance gap between black and white people. Here I would re-iterate that it is no less rude or racist to blame this difference on the supposed immoral behavior of white people. The only reason I’ve even brought this up is to defend white people against this charge. We can also note that, obviously, a group difference in averages is just that, a difference in averages, and there are individuals of all types in every racial group.
 Turning the interest rates, it is true that Black people are more than twice as likely as whites to get a mortgage interest rate of 8% or more. But this is very rare even among black mortgage holders. The average interest rate seems to be similar among whites, Hispanics, and blacks, though possibly significantly lower for Asians.
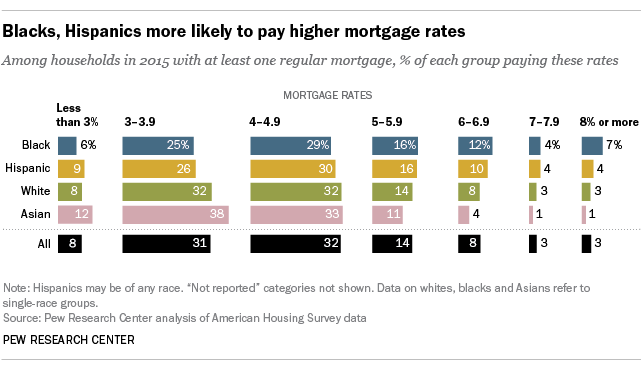 So these differences are real but fairly small. Leftists are apt to point out that some of these differences exist even after controlling for credit scores. This is true, but the remaining differences are really quite small. For instance, Cheng et al. (2014) analyzed data from the U.S. Survey of Consumer Finances for the years 2001, 2004, and 2006 and found that controlling for measures of consumer behavior and debt risk reduced the black-white average interest rate gap to 0.29%
More importantly, credit scores don’t predict behavior equally well across races. Consider the following from a report given to congress by the federal reserve on how well loan performance is predicted by credit scores: “Consistently, across all three credit scores and all five performance measures, blacks… show consistently higher incidences of bad performance than would be predicted by the credit scores (p.89)”. In other words, loans to black people have a higher risk of default even after controlling for credit score.
This report also notes that this is largely just true of black and white people with poor credit scores. Among those with high credit scores, there isn’t much of a difference across race in risk. Relatedly, a study by the Chicago federal reserve found no racial bias in loan approval rates among those with a good credit score but a significant bias in favor of whites among those with a bad credit score.
The strongest evidence against racial bias in lending comes from Bhutta and Hizmo (2019). They analyzed a data set consisting of all FHA-insured mortgages that originated in 2014 and 2015. After controlling for lender effects, credit score, and income, they found a black-white interest gap of 0.03% and a Hispanic-white gap of .015%. Moreover, it was found that minorities had on average paid for fewer discount points than whites. Correcting for this, it was shown that people of each race face the same price schedule.
Thus, there appears to be no racial bias in the willingness of banks to give people loans.
So these differences are real but fairly small. Leftists are apt to point out that some of these differences exist even after controlling for credit scores. This is true, but the remaining differences are really quite small. For instance, Cheng et al. (2014) analyzed data from the U.S. Survey of Consumer Finances for the years 2001, 2004, and 2006 and found that controlling for measures of consumer behavior and debt risk reduced the black-white average interest rate gap to 0.29%
More importantly, credit scores don’t predict behavior equally well across races. Consider the following from a report given to congress by the federal reserve on how well loan performance is predicted by credit scores: “Consistently, across all three credit scores and all five performance measures, blacks… show consistently higher incidences of bad performance than would be predicted by the credit scores (p.89)”. In other words, loans to black people have a higher risk of default even after controlling for credit score.
This report also notes that this is largely just true of black and white people with poor credit scores. Among those with high credit scores, there isn’t much of a difference across race in risk. Relatedly, a study by the Chicago federal reserve found no racial bias in loan approval rates among those with a good credit score but a significant bias in favor of whites among those with a bad credit score.
The strongest evidence against racial bias in lending comes from Bhutta and Hizmo (2019). They analyzed a data set consisting of all FHA-insured mortgages that originated in 2014 and 2015. After controlling for lender effects, credit score, and income, they found a black-white interest gap of 0.03% and a Hispanic-white gap of .015%. Moreover, it was found that minorities had on average paid for fewer discount points than whites. Correcting for this, it was shown that people of each race face the same price schedule.
Thus, there appears to be no racial bias in the willingness of banks to give people loans.


 At the economy-wide level, Alesina et al. (2004) found that ethnic diversity negatively correlates with economic success such that going from perfect homogeneity to maximal diversity predicts a 2% decline in the annual national growth rate of GDP per capita. Even comparing nations that start with the same level of economic development, the nation with greater ethnic diversity will have a lesser rate of economic growth going forward (Posner, 2004).
 In the context of education people say that experiencing a diverse student body is beneficial for everyone. In reality, school diversity predicts negative outcomes with respect to student-rated school satisfaction, Consider the evidence from Rothman, Lipset, and Nevitte (2003). This paper analyzed the relationship between racial diversity and the experiences people had at school in a sample drawn from 140 American universities (N = 4,083 individuals, 1,643 students, 1632 faculty members, 808 administrators). They found the following:
“As the proportion of black students rose, student satisfaction with their university experience dropped, as did their assessments of the quality of their education and the work ethic of their peers. In addition, the higher the enrollment diversity, the more likely students were to say that they personally experienced discrimination… Faculty members also rated students as less hard-working as diversity increased…
Enrollment diversity was positively related to students’ experience of unfair treatment, even after the effects of all other variables were controlled. (As the proportion of black students grew, the incidence of these personal grievances increased among whites. Among blacks, however, there was no significant correlation. Thus diversity appears to increase complaints of unfair treatment among white students without reducing them among black students.)”.
These perceptions of discrimination were not shared by the non-student sample. The authors write:
“Among faculty and administrators, higher minority enrollment was significantly associated with perceptions of less campus discrimination and, among administrators, more positive treatment of minority students. But these findings were offset by the absence of similar results among students, who reported more personal victimization as diversity increased.”
All these results continued to be true after controlling for various measures of socio-economic status.
Owen et al. (2015) also found that “Students at more racially diverse institutions are less happy. They report lower levels of positive emotional well-being and higher levels of negative emotional well-being and of negative life evaluation”. They report that diversity is a similarly negative experience for each racial group.
Setting how students feel about their school aside, Bohrnstedt (2015) finds that both black and white students score worse on standardized tests the greater the proportion of their school that is black.
Turning to bullying, Farris (2006) finds that black students are more likely to be bullies than are Whites students while white students are more likely than black students to be the victims of bullying. Latino students are both more likely than black students to be engage in, and be a victim of, bullying. Farris also finds that racial differences in family SES, neighborhood SES, attachment to friends, parents, and school, and physical development, don’t explain racial differences in bullying.
In the context of education people say that experiencing a diverse student body is beneficial for everyone. In reality, school diversity predicts negative outcomes with respect to student-rated school satisfaction, Consider the evidence from Rothman, Lipset, and Nevitte (2003). This paper analyzed the relationship between racial diversity and the experiences people had at school in a sample drawn from 140 American universities (N = 4,083 individuals, 1,643 students, 1632 faculty members, 808 administrators). They found the following:
“As the proportion of black students rose, student satisfaction with their university experience dropped, as did their assessments of the quality of their education and the work ethic of their peers. In addition, the higher the enrollment diversity, the more likely students were to say that they personally experienced discrimination… Faculty members also rated students as less hard-working as diversity increased…
Enrollment diversity was positively related to students’ experience of unfair treatment, even after the effects of all other variables were controlled. (As the proportion of black students grew, the incidence of these personal grievances increased among whites. Among blacks, however, there was no significant correlation. Thus diversity appears to increase complaints of unfair treatment among white students without reducing them among black students.)”.
These perceptions of discrimination were not shared by the non-student sample. The authors write:
“Among faculty and administrators, higher minority enrollment was significantly associated with perceptions of less campus discrimination and, among administrators, more positive treatment of minority students. But these findings were offset by the absence of similar results among students, who reported more personal victimization as diversity increased.”
All these results continued to be true after controlling for various measures of socio-economic status.
Owen et al. (2015) also found that “Students at more racially diverse institutions are less happy. They report lower levels of positive emotional well-being and higher levels of negative emotional well-being and of negative life evaluation”. They report that diversity is a similarly negative experience for each racial group.
Setting how students feel about their school aside, Bohrnstedt (2015) finds that both black and white students score worse on standardized tests the greater the proportion of their school that is black.
Turning to bullying, Farris (2006) finds that black students are more likely to be bullies than are Whites students while white students are more likely than black students to be the victims of bullying. Latino students are both more likely than black students to be engage in, and be a victim of, bullying. Farris also finds that racial differences in family SES, neighborhood SES, attachment to friends, parents, and school, and physical development, don’t explain racial differences in bullying.
 With respect to interracial bullying, Farris finds that black on white bullying is 64% more common than is White on Black bullying.
 In part, these differences probably arise because bullying is socially rewarded in non-white student subcultures. After controlling for gender, age, academic performance, family structure, parental educational attainment, and extracurricular activities, Farris finds that the more non-white students bully others, the more popular they are among their peers. This effect does not exist among white students.
 Perhaps most dramatically, Farris finds the following: “Regardless of race, attending a high-minority school increases risk of suicide significantly: for every one percentage point increase in the percent minority in the school, the likelihood of suicide increases by one percent.”
Sticking with suicide but moving to adult populations, Becares et al. (2018) conducted a meta-analysis and found that a 10% increase in the local representation of one’s own ethnic group predicts an 12% decrease in the odds of a person being suicidal. Similarly, Putnam (2007) found that people who lived in more diverse cities reported being less happy, having fewer friends, and trusting others less. It’s also worth noting that the negative effect of diversity on social capital persists after controlling for socio-economic status (Denisen et al, 2020; Putnam, 2007).
Perhaps most dramatically, Farris finds the following: “Regardless of race, attending a high-minority school increases risk of suicide significantly: for every one percentage point increase in the percent minority in the school, the likelihood of suicide increases by one percent.”
Sticking with suicide but moving to adult populations, Becares et al. (2018) conducted a meta-analysis and found that a 10% increase in the local representation of one’s own ethnic group predicts an 12% decrease in the odds of a person being suicidal. Similarly, Putnam (2007) found that people who lived in more diverse cities reported being less happy, having fewer friends, and trusting others less. It’s also worth noting that the negative effect of diversity on social capital persists after controlling for socio-economic status (Denisen et al, 2020; Putnam, 2007).
 Other research finds that people are happier when they represent the majority of the local population, that being a member of the dominant racial group of a church congregation predicts a greater sense of belonging in the church, having more friends in the church, and participating in more church activities, and that people rate their customer service experiences better when dealing with co-ethnics (Kanazawa et al., 2015; Martinez et al., 2013; Montoya et al., 2013).
At the national level, ethnic diversity is also correlated with higher crime rates (Marier et al., 2020). At the level of US counties, it’s also been shown that the more black or hispanic people live in a county the higher that counties property and violent crime rate tends to be and this remains true after controlling for poverty, region, population density, age, unemployment, education, and divorce rates (Kposowa et al., 1995). In fact, the percent of the population that is black is a better predictor of violent crime than is any of the other variables I’ve just listed.
Other research finds that people are happier when they represent the majority of the local population, that being a member of the dominant racial group of a church congregation predicts a greater sense of belonging in the church, having more friends in the church, and participating in more church activities, and that people rate their customer service experiences better when dealing with co-ethnics (Kanazawa et al., 2015; Martinez et al., 2013; Montoya et al., 2013).
At the national level, ethnic diversity is also correlated with higher crime rates (Marier et al., 2020). At the level of US counties, it’s also been shown that the more black or hispanic people live in a county the higher that counties property and violent crime rate tends to be and this remains true after controlling for poverty, region, population density, age, unemployment, education, and divorce rates (Kposowa et al., 1995). In fact, the percent of the population that is black is a better predictor of violent crime than is any of the other variables I’ve just listed.
 A final myth about diversity to dispel is the idea, called “contact theory” that if you get people of different races to interact with each other they will become less racially biased. There is research indicating this is true, once you correct for publication bias you find that there is actually a modest (ns) tendency for racial bias to increase in response to cross-racial contact (Paluck et al., 2019).
 Second, Alpert et al. (2007) finds that white (and Hispanic) police officers are less likely than black police officers to pull over a black citizen. Given that black people generally exhibit a pro-ingroup bias, if racial bias were driving stop rates you’d expect black officers to stop fewer black citizens.
 Smith et al. (2001) made the same fining.
 Another line of evidence comes from Lange et al. (2005). This paper used cameras to directly measure racial differences in speeding and found that “the proportion of speeding drivers who were identified as Black mirrored the proportion of Black drivers stopped by police”.
 It is also worth mentioning the role that matching the description of a criminal suspect plays in police stops. As already noted, the high rate at which black people are arrested corresponds to the rate at which criminal offenders are described as black in police incident reports. With respect to police stops, as documented by Greenwald (2001) black people make up a greater proportion of police suspects than they do people who are stopped.
 The next study to examine is Alpert et al. (2006). In this study citizen observers accompanied police and recorded the exact reasons for suspicions which lead to a person being stopped. Doing so they concluded “officers were equally likely to stop individuals whether they were male or female, African-American or white, low or high socioeconomic status.” and there data does indeed show that race was unrelated to the probability of being stopped.
 Importantly, black people made up 71% of those stopped by police so there is reason to think that the police did not avoid pulling black people over just because they were being observed.
The paper also documented that black people were more than 4 times as likely as white people to have suspicions formed against them by police for reasons unrelated to any directly visible illegal behavior.
Importantly, black people made up 71% of those stopped by police so there is reason to think that the police did not avoid pulling black people over just because they were being observed.
The paper also documented that black people were more than 4 times as likely as white people to have suspicions formed against them by police for reasons unrelated to any directly visible illegal behavior.
 This was especially true when the police officer forming the relevant suspicion was black, suggesting this tendency was not due to racial bias.
 The paper goes on to detail several examples in which a very high level of “non-behavioral” suspicion was formed by police officers: “in one case the officer formed suspicion because the suspect was driving a motor vehicle that fit the description of a “G-ride” – heavily tinted windows, custom rims, and a flashy paint job. Four out of these thirteen cases involved vehicles that matched a BOLO (be on the lookout) call. One case involved a suspect who was in the vicinity of a robbery and shooting that had occurred recently. Two cases involved suspects who appeared to act nervous when officers pulled next to their cars. Another case involved a woman hiding in the “shadows of a known prostitution area.” The narrative descriptions of cases indicate that the probability of non-behavioral suspicion was greatly influenced by officers having pre-existing information on suspects or events where civilians were in areas of known criminal activity, or where civilians acted nervous when the police approached.”
Given that these reasons tend to depend on the ability to clearly see what is happening, it is unsurprising that police form most of their suspicions, and carry out most of their stops, during the day time when the sun is out.
The paper goes on to detail several examples in which a very high level of “non-behavioral” suspicion was formed by police officers: “in one case the officer formed suspicion because the suspect was driving a motor vehicle that fit the description of a “G-ride” – heavily tinted windows, custom rims, and a flashy paint job. Four out of these thirteen cases involved vehicles that matched a BOLO (be on the lookout) call. One case involved a suspect who was in the vicinity of a robbery and shooting that had occurred recently. Two cases involved suspects who appeared to act nervous when officers pulled next to their cars. Another case involved a woman hiding in the “shadows of a known prostitution area.” The narrative descriptions of cases indicate that the probability of non-behavioral suspicion was greatly influenced by officers having pre-existing information on suspects or events where civilians were in areas of known criminal activity, or where civilians acted nervous when the police approached.”
Given that these reasons tend to depend on the ability to clearly see what is happening, it is unsurprising that police form most of their suspicions, and carry out most of their stops, during the day time when the sun is out.
 I’ve emphasized that black people are more often than white people pulled over for being suspicious in ways that are easier to see during daylight as a way of preemptively critiquing a method for detecting racial bias called the “Veil of Darkness” test. This test is based on the idea that more black people being pulled over in the daylight than while it is dark is evidence that during the daylight officers are noticing that drivers are black and pulling them over for this reason. As we’ve already seen, the literature on police stops provides good reason to think that black people will be pulled over more during the day even in the absence of any racial bias. For this reason, the Veil of Darkness is not a proper test of discrimination.
Moreover, it isn’t actually clear that black people are pulled over more during the day. The first paper to use this test actually found that black people were pulled over more at night in Oakland, Ca (Grogger et al., 2006). Other research found that there was no difference in the rate black people were pulled over during day and night in Syracuse, NY and Cincinnati, OH (Worden et al., 2012; Ridgeway, 2009). But other people found that black people were pulled over more during the day and the weight of evidence temporarily shifted when Pierson et al. (2020) found black people were pulled over 3% more during the day than at night in a sample of tens of millions of stops from a variety of states (headlines often reported the sample size as 100 million but this is seemingly the sample they had for other analyses in the paper, the veil of darkness test was limited to data from 120 days and certain hours of the day/night and so is presumably just a fraction of the often cited 100 million figure). But then Stelter et al. (2022) found that blacks are pulled over more during the night in a sample of 18 million stops. It is now clear that whether black people are stopped more during the day, the night, or equally in both, depends on where in America you look. There is no way to be confident about what the national average is, but as noted this isn’t a proper test of discrimination in any case and so this lack of confidence should not trouble us.
The last issue concerning stop rates to talk about is stop and frisk. This policy was carried out in New York City and so cannot be taken as strong evidence of any national bias in stop rates. That being said, the policy did not lead to bias in NYC either. The largest analysis done on this policy found that black people were stopped more often than white people but that stopped black and white people were equally likely to be found doing something deserving of arrest indicating that police were just reacting rationally to the higher crime rates of black people (Coviello et al., 2015).
To sum up this section, the lack of racial bias in arrest data gives us a strong reason to think that stop rates are not biased. This notion is further supported by evidence from research using cameras to measure student behavior, by research that sent citizens to ride along with police and document the reasons for police stops, and by research on the rate at which black police officers stop black citizens. It isn’t clear whether black people are pulled over more during the day or night but in either case this would not be solid grounds upon which to conclude discrimination is taking place. And so the weight of the evidence favors the view that police stop rates are not racially biased.
I’ve emphasized that black people are more often than white people pulled over for being suspicious in ways that are easier to see during daylight as a way of preemptively critiquing a method for detecting racial bias called the “Veil of Darkness” test. This test is based on the idea that more black people being pulled over in the daylight than while it is dark is evidence that during the daylight officers are noticing that drivers are black and pulling them over for this reason. As we’ve already seen, the literature on police stops provides good reason to think that black people will be pulled over more during the day even in the absence of any racial bias. For this reason, the Veil of Darkness is not a proper test of discrimination.
Moreover, it isn’t actually clear that black people are pulled over more during the day. The first paper to use this test actually found that black people were pulled over more at night in Oakland, Ca (Grogger et al., 2006). Other research found that there was no difference in the rate black people were pulled over during day and night in Syracuse, NY and Cincinnati, OH (Worden et al., 2012; Ridgeway, 2009). But other people found that black people were pulled over more during the day and the weight of evidence temporarily shifted when Pierson et al. (2020) found black people were pulled over 3% more during the day than at night in a sample of tens of millions of stops from a variety of states (headlines often reported the sample size as 100 million but this is seemingly the sample they had for other analyses in the paper, the veil of darkness test was limited to data from 120 days and certain hours of the day/night and so is presumably just a fraction of the often cited 100 million figure). But then Stelter et al. (2022) found that blacks are pulled over more during the night in a sample of 18 million stops. It is now clear that whether black people are stopped more during the day, the night, or equally in both, depends on where in America you look. There is no way to be confident about what the national average is, but as noted this isn’t a proper test of discrimination in any case and so this lack of confidence should not trouble us.
The last issue concerning stop rates to talk about is stop and frisk. This policy was carried out in New York City and so cannot be taken as strong evidence of any national bias in stop rates. That being said, the policy did not lead to bias in NYC either. The largest analysis done on this policy found that black people were stopped more often than white people but that stopped black and white people were equally likely to be found doing something deserving of arrest indicating that police were just reacting rationally to the higher crime rates of black people (Coviello et al., 2015).
To sum up this section, the lack of racial bias in arrest data gives us a strong reason to think that stop rates are not biased. This notion is further supported by evidence from research using cameras to measure student behavior, by research that sent citizens to ride along with police and document the reasons for police stops, and by research on the rate at which black police officers stop black citizens. It isn’t clear whether black people are pulled over more during the day or night but in either case this would not be solid grounds upon which to conclude discrimination is taking place. And so the weight of the evidence favors the view that police stop rates are not racially biased.
 Alpert et al. (2007) finds that white (and Hispanic) police officers are more likely than black police officers to search a black citizen. But same study found white officers were less likely to pull black people over to begin with, so this evidence merely suggests that white officers are being more accurate in who they pull over.
 Smith et al. (2001), on the other hand, find that officer race is unrelated to the probability of a black citizen being searched.
 Similarly, Baumgartner et al. (2018) finds that, if anything, the gap in search rates between blacks and whites is greatest among those pulled over by black police officers.
 A common argument used to show that search rates are racially biased goes like this: among those the police pull over or search, whites are more likely than nonwhites to be found guilty of a crime meaning the amount of evidence for criminality police require before they will pull over or search white people is higher than the bar of evidence they use for nonwhites. After all, if , for instance, police searched everyone of both races with a 50% or higher chance being a criminal then the arrest rate among people who have been searched would be the same for each group. The fact that more whites are arrested than blacks among those searched could only happen if, for instance, whites had to have a 60% chance of being a criminal before being searched whereas nonwhites were searched if they had a 40% chance or higher of being a criminal.
Empirically, the largest national dataset available indicates that the hit rate for police stops is 2 percentage points higher for blacks (32%) than it is for whites (34%), so there is a difference but it is quite slight (Ekstrom et al, 2022).
However, inferring any discrimination on this basis is not valid reasoning. Though this argument was popular in left wing circles for many years, it is now recognized by mainstream academics as statistically unsound. For instance, Pierson et al. (2020) write: “suppose that there are two, easily distinguishable, types of white driver: those who have a 5% chance of carrying contraband and those who have a 75% chance of carrying contraband. Likewise assume that black drivers have either a 5 or 50% chance of carrying contraband. If officers search drivers who are at least 10% likely to be carrying contraband, then searches of white drivers will be successful 75% of the time whereas searches of black drivers will be successful only 50% of the time. Thus, although the search criterion is applied in a race-neutral manner, the hit rate for black drivers is lower than that for white drivers and the outcome test would (incorrectly) conclude that searches are biased against black drivers”
To take a more concrete example, imagine you have ten white kids in one room and ten black kids in another and you know that one person in each room has an illegal substance on them. If each kid within each room has the same chance of being a criminal then each has a 10% chance and so a rule, for instance, of searching people who have a 15% or higher chance of being a criminal will lead to no searches. But of course police operate on the basis of the fact that everyone is not equally likely to be a criminal. Suppose you have reason to think that people who dress in certain ways have an elevated risk of criminality such that anyone in either of these rooms who dresses that way has a greater than 15% chance of being a criminal. Finally, imagine that two white kids and three black kids dress this way, you search all five, find the illegal substance in both rooms, and so have a hit rate of 50% for whites and 33% for blacks despite searching everyone in both rooms using the same 15%+ bar of evidence.
The way that the chance of being a criminal is divided up among people within a group is called their distribution of criminal risk and the hit rate test assumes that this distribution is identical across groups. Given the slight difference in hit rate by groups, even a slight deviation from this assumption could explain the racial difference in hit rates. But there is no reason to think groups would have identical risk distributions and in fact it would be a coincidence of miraculous proportions if they did so the hit rate test cannot be used to infer that police use a lower bar of evidence for searching black people.
There is a method called a threshold test which researchers have used to directly estimate, by race, the minimum probability of criminality that police require someone to meet prior to searching them. Such research has estimated this minimum threshold to be 23% in the case of whites and 21% in the case of blacks, indicating the possibility of a slight racial bias in search rates (Ekstrom et al, 2022). However, as noted in the paper that developed this method: “if officers disproportionately suspect more serious criminal activity when searching black and Hispanic drivers compared to white drivers (for example, possession of larger quantities of contraband), then lower observed thresholds may stem from non-discriminatory police practices” (Pierson et al, 2020). Empirically, it is true that the offenses of black criminals are on average more serious than the offenses of white criminals (Everett et al., 2003). Given this, the threshold test cannot differentiate between police engaging in racial bias and police acting rationally given objective differences in criminality between black and white people.
To sum up this section, the lack of significance for race in models predicting who gets searched after controlling for obvious confounds suggest that search rates are not biased. Alternative ways of analyzing the question like hit rate tests and threshold tests imply the possibility of a slight bias but there are also plausible alternative explanations for these findings. Given this, we are not justified in concluding that the rate at which police search black people is racially biased. Importantly, if black people were being searched (or stops) at an unfair rate this would undoubtably lead to them being arrested at an unfair rate since even unfair searches of citizens will sometimes lead to arrests. Given this, the lack of racial bias in arrest rates evidenced in the next section constitutes powerful further evidence against the idea that search (or stop) rates are racially biased.
A common argument used to show that search rates are racially biased goes like this: among those the police pull over or search, whites are more likely than nonwhites to be found guilty of a crime meaning the amount of evidence for criminality police require before they will pull over or search white people is higher than the bar of evidence they use for nonwhites. After all, if , for instance, police searched everyone of both races with a 50% or higher chance being a criminal then the arrest rate among people who have been searched would be the same for each group. The fact that more whites are arrested than blacks among those searched could only happen if, for instance, whites had to have a 60% chance of being a criminal before being searched whereas nonwhites were searched if they had a 40% chance or higher of being a criminal.
Empirically, the largest national dataset available indicates that the hit rate for police stops is 2 percentage points higher for blacks (32%) than it is for whites (34%), so there is a difference but it is quite slight (Ekstrom et al, 2022).
However, inferring any discrimination on this basis is not valid reasoning. Though this argument was popular in left wing circles for many years, it is now recognized by mainstream academics as statistically unsound. For instance, Pierson et al. (2020) write: “suppose that there are two, easily distinguishable, types of white driver: those who have a 5% chance of carrying contraband and those who have a 75% chance of carrying contraband. Likewise assume that black drivers have either a 5 or 50% chance of carrying contraband. If officers search drivers who are at least 10% likely to be carrying contraband, then searches of white drivers will be successful 75% of the time whereas searches of black drivers will be successful only 50% of the time. Thus, although the search criterion is applied in a race-neutral manner, the hit rate for black drivers is lower than that for white drivers and the outcome test would (incorrectly) conclude that searches are biased against black drivers”
To take a more concrete example, imagine you have ten white kids in one room and ten black kids in another and you know that one person in each room has an illegal substance on them. If each kid within each room has the same chance of being a criminal then each has a 10% chance and so a rule, for instance, of searching people who have a 15% or higher chance of being a criminal will lead to no searches. But of course police operate on the basis of the fact that everyone is not equally likely to be a criminal. Suppose you have reason to think that people who dress in certain ways have an elevated risk of criminality such that anyone in either of these rooms who dresses that way has a greater than 15% chance of being a criminal. Finally, imagine that two white kids and three black kids dress this way, you search all five, find the illegal substance in both rooms, and so have a hit rate of 50% for whites and 33% for blacks despite searching everyone in both rooms using the same 15%+ bar of evidence.
The way that the chance of being a criminal is divided up among people within a group is called their distribution of criminal risk and the hit rate test assumes that this distribution is identical across groups. Given the slight difference in hit rate by groups, even a slight deviation from this assumption could explain the racial difference in hit rates. But there is no reason to think groups would have identical risk distributions and in fact it would be a coincidence of miraculous proportions if they did so the hit rate test cannot be used to infer that police use a lower bar of evidence for searching black people.
There is a method called a threshold test which researchers have used to directly estimate, by race, the minimum probability of criminality that police require someone to meet prior to searching them. Such research has estimated this minimum threshold to be 23% in the case of whites and 21% in the case of blacks, indicating the possibility of a slight racial bias in search rates (Ekstrom et al, 2022). However, as noted in the paper that developed this method: “if officers disproportionately suspect more serious criminal activity when searching black and Hispanic drivers compared to white drivers (for example, possession of larger quantities of contraband), then lower observed thresholds may stem from non-discriminatory police practices” (Pierson et al, 2020). Empirically, it is true that the offenses of black criminals are on average more serious than the offenses of white criminals (Everett et al., 2003). Given this, the threshold test cannot differentiate between police engaging in racial bias and police acting rationally given objective differences in criminality between black and white people.
To sum up this section, the lack of significance for race in models predicting who gets searched after controlling for obvious confounds suggest that search rates are not biased. Alternative ways of analyzing the question like hit rate tests and threshold tests imply the possibility of a slight bias but there are also plausible alternative explanations for these findings. Given this, we are not justified in concluding that the rate at which police search black people is racially biased. Importantly, if black people were being searched (or stops) at an unfair rate this would undoubtably lead to them being arrested at an unfair rate since even unfair searches of citizens will sometimes lead to arrests. Given this, the lack of racial bias in arrest rates evidenced in the next section constitutes powerful further evidence against the idea that search (or stop) rates are racially biased.

 The other major benchmark often used to analyze bias in arrest rates is self reported crime rates. This is most often done in the context of drug crime. Liberals will say that blacks and whites self report using drugs at equal rates but blacks are arrested more for such crimes and that this is evidence of bias. Of course, self report data leaves open the possibility that people will lie but so long as the races are equally likely to lie about criminal activity this will not be a problem for an analysis of racial disparities. However, this assumption is not accurate. Multiple studies have used drug tests to show that African Americans are more likely than white Americans to falsely claim that they haven’t done drugs (Fendrich et al., 2005; Page et al., 1977; Falck et al., 1992; Feucht et al, 1994; Johnson et al., 2003). For this reason, self report data is not a valid benchmark for assessing racial bias in arrest rates.
Moreover, African Americans are more likely than white Americans to use drugs in high-crime areas, to use and buy drugs outside, to buy drugs from strangers, and to engage in other behaviors that elevate their risk for arrest above what you would expect given the rates at which African Americans report using drugs (Lagan 1995; Ramchand et al., 2006). Though to my knowledge undocumented, there may be similar behavioral differences in how other crimes are committed. To the degree that this is true, we’d expect black people to be arrested for crimes at a rate which is higher than the rate at which they commit those crimes even in a racially unbiased society.
Another line of evidence against racial bias in arrest rates is the fact that black police officers are no less likely than white police officers to arrest black citizens (Smith et al., 2001).
The other major benchmark often used to analyze bias in arrest rates is self reported crime rates. This is most often done in the context of drug crime. Liberals will say that blacks and whites self report using drugs at equal rates but blacks are arrested more for such crimes and that this is evidence of bias. Of course, self report data leaves open the possibility that people will lie but so long as the races are equally likely to lie about criminal activity this will not be a problem for an analysis of racial disparities. However, this assumption is not accurate. Multiple studies have used drug tests to show that African Americans are more likely than white Americans to falsely claim that they haven’t done drugs (Fendrich et al., 2005; Page et al., 1977; Falck et al., 1992; Feucht et al, 1994; Johnson et al., 2003). For this reason, self report data is not a valid benchmark for assessing racial bias in arrest rates.
Moreover, African Americans are more likely than white Americans to use drugs in high-crime areas, to use and buy drugs outside, to buy drugs from strangers, and to engage in other behaviors that elevate their risk for arrest above what you would expect given the rates at which African Americans report using drugs (Lagan 1995; Ramchand et al., 2006). Though to my knowledge undocumented, there may be similar behavioral differences in how other crimes are committed. To the degree that this is true, we’d expect black people to be arrested for crimes at a rate which is higher than the rate at which they commit those crimes even in a racially unbiased society.
Another line of evidence against racial bias in arrest rates is the fact that black police officers are no less likely than white police officers to arrest black citizens (Smith et al., 2001).
 Actually, in a model that included far better controls than smith et al’s, Brown et al. (2007) found that offender race did not predict who white officers would arrest while black officers were more likely to arrest citizens who were black.
 The final line of evidence I’m going to cite concerning arrests rates is the research showing that directly controlling for psychological factors eliminates the association between being black and the probability of being arrested. Two studies have shown this. First, Shwartz et al. (2019) found that race was unrelated to the chance of being arrested after controlling for sex, IQ, impulsivity, and previous time spent in jail in a sample of 1,331 ex-cons.
 Second, Beaver et al. (2013) were able to reduce this association to statistical insignificance merely be controlling for age, IQ, and self reported history of violence.
 To conclude this section, it is hopefully now clear the evidence for racial bias in arrest rates relies on faulty benchmarks while a closer look at the relevant data suggests there is no anti-black bias.
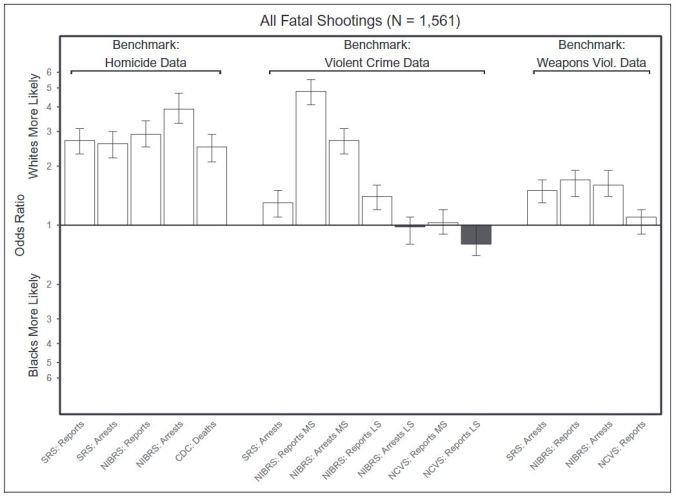

 This analysis was done at the national level, but you could conduct a similar analysis at lower levels of aggregation. This was done by Mentch (2020) who conducted a county level analysis and found that black and Hispanic Americans were not over-represented among those killed by police relative to what you would expect given their local arrest rates. Another local analysis was done by Weistburst (2019) who found that black people were not over-represented among those killed by the Dallas police department relative to their arrest rates in Dallas.
Johnson et al. (2020) also conducted a county level analysis showing that minorities are less likely to be shot by police than are whites using a crime benchmark.
This analysis was done at the national level, but you could conduct a similar analysis at lower levels of aggregation. This was done by Mentch (2020) who conducted a county level analysis and found that black and Hispanic Americans were not over-represented among those killed by police relative to what you would expect given their local arrest rates. Another local analysis was done by Weistburst (2019) who found that black people were not over-represented among those killed by the Dallas police department relative to their arrest rates in Dallas.
Johnson et al. (2020) also conducted a county level analysis showing that minorities are less likely to be shot by police than are whites using a crime benchmark.
 Using arrest data or violent crime rates is better than using population size as a benchmark but it is obviously imperfect as a estimate of what we really want, namely the frequency with which people engage in seriously dangerous violence in the presence of police officers.
The best benchmark we can use to get at this is the rate at which populations attack police officers. Such an analysis was carried out by Shjarback et al. (2020) who found that using such a benchmark rendered the probability of a black American being shot by police roughly 40% lower than the probably of a white American being shot by police. For Hispanics, there was either no difference or evidence of an anti-Hispanic bias depending on whether the benchmark was the rate at which people killed police or the rate at which they assaulted police.
Using arrest data or violent crime rates is better than using population size as a benchmark but it is obviously imperfect as a estimate of what we really want, namely the frequency with which people engage in seriously dangerous violence in the presence of police officers.
The best benchmark we can use to get at this is the rate at which populations attack police officers. Such an analysis was carried out by Shjarback et al. (2020) who found that using such a benchmark rendered the probability of a black American being shot by police roughly 40% lower than the probably of a white American being shot by police. For Hispanics, there was either no difference or evidence of an anti-Hispanic bias depending on whether the benchmark was the rate at which people killed police or the rate at which they assaulted police.
 Another line of evidence related to police shootings, but somewhat broader, concerns studies which attempt to control for situational differences and estimate the bias in the rate at which police use force. Taking these studies as a whole, they tend to show an anti-black bias in police behavior. However, this is because studies supporting this conclusion are more likely to be published than are studies which contradict this view. Correcting for this publication bias, there is no relationship between suspect race and the rate at which police use force.
 Another line of evidence against racial bias is the fact that black police officers are not less likely than white police officers to kill black citizens. This is the finding of Meinfeld et al. (2018)
 Similarly, Johnson et al. (2019) find that blacker police forces don’t kill fewer black civilians.
 As should now be clear, the weight evidence does not favor the view that there is an anti-black bias in the rate at which people are killed by police and in fact the strongest evidence indicates that there is a pro-black bias in the rate of such killings.
 Research by the New Century Foundation (2005) produced similar results:
 Thus, incarceration rates seem to about as racially biases as are arrest rates and as we’ve already seen there are good reasons for thinking that arrest rates are not racially biased.
It is also worth noting that the black-white difference in likelihood of being incarcerated is not statistically significant if you simply control for age, IQ, and self reported history of violence (Beaver et al., 2013).
Thus, incarceration rates seem to about as racially biases as are arrest rates and as we’ve already seen there are good reasons for thinking that arrest rates are not racially biased.
It is also worth noting that the black-white difference in likelihood of being incarcerated is not statistically significant if you simply control for age, IQ, and self reported history of violence (Beaver et al., 2013).
 Given all this, we are justified in concluding that the rate at which black people are incarcerated probably does not reflect racial bias to any significant degree.
 Similarly, Pratt (1998) combined data from 47 studies via meta-analysis and found that race was unrelated to sentence length after controlling for offense severity and criminal history.
 Thus, the weight of meta-analytic evidence supports the view that sentencing is not racially biased.
Simon et al. (1996) is probably the most informative single study on sentencing because it not only controlled for crime type, victim injury, criminal history etc., but also IQ. It produced two findings of note. First, holding all other variables constant IQ is a significant predictor of sentencing. This demonstrates that the rest of the literature on sentencing has omitted from its models a variable which differs by race and impacts sentencing. Secondly, it found that in a model which corrected for IQ as well as the standard criminological controls, race was not related to sentence length.
Thus, the weight of meta-analytic evidence supports the view that sentencing is not racially biased.
Simon et al. (1996) is probably the most informative single study on sentencing because it not only controlled for crime type, victim injury, criminal history etc., but also IQ. It produced two findings of note. First, holding all other variables constant IQ is a significant predictor of sentencing. This demonstrates that the rest of the literature on sentencing has omitted from its models a variable which differs by race and impacts sentencing. Secondly, it found that in a model which corrected for IQ as well as the standard criminological controls, race was not related to sentence length.
 Lastly, it is worth noting that black and white judges sentence black and white offenders similarly suggesting that racial animus is not the cause of the racial gap in sentencing. To my knowledge, Ulhman, (1978) was the first study to document this fact.
 The same was found by Steffenmeier et al. (2001).
 To conclude, meta-analyses show there is no racial bias in sentencing. Moreover, sentencing disparities are similar regardless of the race of the judge doing the sentencing. Perhaps most importantly, all research but one study fails to control for IQ, a variable which differs by race and predicts sentencing, and this study finds no evidence of racial bias. Clearly then, on net the evidence does not justify thinking that racial bias is present in sentencing rates.
 I’ve been able to find 14 studies done after 1981 which assessed the impact of a defendant’s race on the chance of them receiving the death penalty. Of these 14 studies, 11 found no effect for race while one indicated an anti-black bias and two indicated a pro-black bias.
 In summary, the totality of the evidence strongly supports the conclusion that there is no anti-black bias in death sentencing and more modestly supports the view that, once psychological variables are accounted for, there is a pro-black bias in death sentencing.
 To put these numbers in a historical context, consider that roughly 3,500 blacks were lynched in the United States between 1882 and 1968. At its height, around 100 black Americans were lynched per year.

 That upper limit having been established, the next thing to note is that wealth doesn’t transmit very well across generations for African Americans. Specifically, Toney (2016) finds that a doubling of the wealth of a person’s grandparents predicts a 60% increase in their own wealth if they are white but only a 9% increase in their wealth if they are black. The same basic point is made by the following chart from Pfeffer et al. (2018):
 This lack of wealth transmission in black families is made especially clear by Chetty et al. (2018) who were given data by the IRS that allowed them to conduct a statistical analysis on the entire US population that filed taxes between the years 1989 and 2015. They write: “A black child born to parents in the top quintile is roughly as likely to fall to the bottom family income quintile as he or she is to remain in the top quintile; in contrast, white children are nearly five times as likely to remain in the top quintile as they are to fall to the bottom quintile”.
What this research implies is that the current link between wealth within black families is such that we would not predict that modern black people having significantly richer ancestors would benefit them much at all in the current day.
Seemingly, the lack of wealth transmission among African Americans is significantly explained by their spending habits independent of income. Research shows that black people have lower saving rates than white people even when they have the same incomes (Dorgo, 2003). More dramatically, Hughes (2018) documents that black Americans spend more on goods like fancy cars and clothing than do white people despite being poorer than them and that such spending directly accounts for around 20% of the black-white wealth gap. Hughes goes on to note the following:
“To make matters worse, spending patterns are just one part of a larger set of financial skills on which blacks lag behind. Researchers at the Federal Reserve Bank of St. Louis followed over 40,000 families from 1989 to 2013, tracking their wealth accumulation and financial decisions. They developed a financial health scale, ranging from 0 to 5, that measured the degree to which families made “routine financial health choices that contribute to wealth accumulation”—e.g., saving any amount of money, paying credit card bills on time, having a low debt-to-income ratio, etc. At 3.12, Asian families scored the highest, followed by whites at 3.11, Hispanics at 2.71, and blacks at 2.63.
Next, they asked if education accounted for the differences in financial habits by limiting the comparison to middle-aged families with advanced degrees. Surprisingly, they found that the racial gap in financial health-scores didn’t shrink; it widened. Highly-educated Asian families scored 3.49, comparable whites scored 3.38, comparable Hispanics scored 2.94, and comparable blacks remained far behind at 2.66.”
Thus, the weak generational transmission of wealth seen among African Americans seems to be a product of their own behaviors.
That said, even these analyses over-state the causal link between wealth and income across generations. Often we speak as if the reason that rich parents tend to have rich kids is because having rich parents causes people to be rich. In fact, in the United States roughly 41% of the variation in income is explained by genes while only 9% is explained by the family home environment (Hytinnen et al., 2019). The necessary implication of this is that the vast majority of the correlation in income between parents and children is due to genes rather than the environment.
Of course, we also should not assume that the small amount of income that is explained by the home environment is all explained by parental income. Research utilizing study designs which rule out the influence of genetics finds that the effects of parental economic success on offspring economic success are weak or non-existent across one to two generations implying that even a weak causal effect is implausible across many generations.
This lack of wealth transmission in black families is made especially clear by Chetty et al. (2018) who were given data by the IRS that allowed them to conduct a statistical analysis on the entire US population that filed taxes between the years 1989 and 2015. They write: “A black child born to parents in the top quintile is roughly as likely to fall to the bottom family income quintile as he or she is to remain in the top quintile; in contrast, white children are nearly five times as likely to remain in the top quintile as they are to fall to the bottom quintile”.
What this research implies is that the current link between wealth within black families is such that we would not predict that modern black people having significantly richer ancestors would benefit them much at all in the current day.
Seemingly, the lack of wealth transmission among African Americans is significantly explained by their spending habits independent of income. Research shows that black people have lower saving rates than white people even when they have the same incomes (Dorgo, 2003). More dramatically, Hughes (2018) documents that black Americans spend more on goods like fancy cars and clothing than do white people despite being poorer than them and that such spending directly accounts for around 20% of the black-white wealth gap. Hughes goes on to note the following:
“To make matters worse, spending patterns are just one part of a larger set of financial skills on which blacks lag behind. Researchers at the Federal Reserve Bank of St. Louis followed over 40,000 families from 1989 to 2013, tracking their wealth accumulation and financial decisions. They developed a financial health scale, ranging from 0 to 5, that measured the degree to which families made “routine financial health choices that contribute to wealth accumulation”—e.g., saving any amount of money, paying credit card bills on time, having a low debt-to-income ratio, etc. At 3.12, Asian families scored the highest, followed by whites at 3.11, Hispanics at 2.71, and blacks at 2.63.
Next, they asked if education accounted for the differences in financial habits by limiting the comparison to middle-aged families with advanced degrees. Surprisingly, they found that the racial gap in financial health-scores didn’t shrink; it widened. Highly-educated Asian families scored 3.49, comparable whites scored 3.38, comparable Hispanics scored 2.94, and comparable blacks remained far behind at 2.66.”
Thus, the weak generational transmission of wealth seen among African Americans seems to be a product of their own behaviors.
That said, even these analyses over-state the causal link between wealth and income across generations. Often we speak as if the reason that rich parents tend to have rich kids is because having rich parents causes people to be rich. In fact, in the United States roughly 41% of the variation in income is explained by genes while only 9% is explained by the family home environment (Hytinnen et al., 2019). The necessary implication of this is that the vast majority of the correlation in income between parents and children is due to genes rather than the environment.
Of course, we also should not assume that the small amount of income that is explained by the home environment is all explained by parental income. Research utilizing study designs which rule out the influence of genetics finds that the effects of parental economic success on offspring economic success are weak or non-existent across one to two generations implying that even a weak causal effect is implausible across many generations.
 To sum up this section, racial wealth gaps are largely present among people with no inheritance. The correlation between parental and offspring wealth is so weak among blacks that having significantly richer ancestors would not have benefited them much. The correlation we usually see between parent and offspring income is mostly due to genetics. And the direct effect of parental economic success on offspring economic success is so weak that a significant effect lasting across many generations is just not plausible. These constitute a strong set of back ground reasons to doubt many common explanations of racial inequality. Given these facts, we should require very strong evidence in favor of such narratives before we accept them as true.

 With respect to home ownership, racial inequality declined significantly between 1870 and 1900 but has remained fairly stagnant since then despite a huge amount of racism still supposedly being present in the early 20th century.
 With respect to out of wedlock birth, the black-white gap has increased in absolute terms but decreased in relative terms since the 1930s.
 If we instead measure the proportion of children under the age of 14 living with only one parent, we find that both the absolute and relative gap between black and white Americans increased in the 20th century (Ruggles, 1994).
 Assessing the historical trend in income is slightly more complicated. Often, people report statistics showing that the ratio of black worker income to white worker income has increased over time. This is true, but caused by the fact that prison sentences and unemployment have removed a disproportionately large share of unproductive people from the pool of black workers. To remove this bias, we should just look at the income ratio of all black people to all white people. If we are interested in racism, we should also restrict our analysis to men because group differences in the rate at which women entered the labor force could distort our result. And of course we’ll want to restrict our analysis to working age men so changes in the age distribution of groups over time don’t distort things. Doing so, we find that racial inequality in income is the same today as it was in 1950, with the ratio of black to white income being roughly 0.51 the whole time.
 This is similar to what is seen in Brazil, 0.50, and England, 0.63 (Bucciferro, 2017 ; Collinson, 2020). In modern day Detroit, the ratio is 0.41 (Danziger et al. 2014). In Chicago its 0.43. That same ratio was 0.53 in the South of America in 1870 (Lindert and Williamson, 2016). In 1880, the ratio of black to white income in the south was 0.58 (Ng and Virts, 1993). (The national ratio was lower because black people tended to live in the South which was poorer than the north and have over time moved out of the South).
Among farm workers in the rural south in 1880, a context in which we’d expect to find the biggest effects of racial animus since slavery ended, the ratio of black to white income was 0.79 (Ng and Virts, 1993). To day, if you control for age, education, work experience, where someone lives, and marital status, that ratio is 0.81 (Farkas 1996). The near identical values of these two figures should greatly lessen our confidence in the mainstream narrative concerning race.
To find levels of inequality significantly greater than what is observed today, you have to go back to the time when slavery was still ongoing. Thus, despite segregation and Jim Crow and the klan, etc., the level of racial inequality seen in the American south has been in line with what is seen today in large long standing black populations ever since 1870. Given this, there is no especially great level of racial inequality that we need to invoke racism to explain. The only kind of explanation that seems appropriate will point to things that black people in present day America, England, and Brazil, as well as the south of 1870, all share in common, and their degree of experience with racism is obviously not such a common factor. Obviously, we should not explain this inequality by pointing to a variable like racism which differs heavily between these locations and times despite the uniformity of inequality observed.
The only places where the ratio of black-to-white incomes are significantly higher is in nations where the black population consists mostly of voluntary immigrants. For instance, the ratio of black to white income is roughly .80 in Canada, .84 in France, and .77 in America when just looking at black immigrants. (CA; Algan et al., 2010; Pew, 2015; Anderson, 2013).
As we’ve already seen, the ratio is lower in Latin America. It is even lower in Africa. For instance, in South Africa, the ratio is 0.16 (Desilver, 2013). The reason that black immigrants tend to do relatively well is therefore not because they come from populations of black people who generally do well relative to whites. Rather, it is because, for the most part, only elite black people from Africa and Latin America have the ability to immigrate to Europe and North America. Of course, it is, by definition, also true that economically elite native black Americans do better relative to whites than is typical. The existence of these immigrant populations is thus no more evidence that fairly treated blacks will do better than is the fact that there are richer than average black people within every black population.
The fact that racial inequality has not lessened as racism has is thus another background reason to doubt common racism based explanations of past inequality and to require a very high bar of evidence be met prior to accepting them.
This is similar to what is seen in Brazil, 0.50, and England, 0.63 (Bucciferro, 2017 ; Collinson, 2020). In modern day Detroit, the ratio is 0.41 (Danziger et al. 2014). In Chicago its 0.43. That same ratio was 0.53 in the South of America in 1870 (Lindert and Williamson, 2016). In 1880, the ratio of black to white income in the south was 0.58 (Ng and Virts, 1993). (The national ratio was lower because black people tended to live in the South which was poorer than the north and have over time moved out of the South).
Among farm workers in the rural south in 1880, a context in which we’d expect to find the biggest effects of racial animus since slavery ended, the ratio of black to white income was 0.79 (Ng and Virts, 1993). To day, if you control for age, education, work experience, where someone lives, and marital status, that ratio is 0.81 (Farkas 1996). The near identical values of these two figures should greatly lessen our confidence in the mainstream narrative concerning race.
To find levels of inequality significantly greater than what is observed today, you have to go back to the time when slavery was still ongoing. Thus, despite segregation and Jim Crow and the klan, etc., the level of racial inequality seen in the American south has been in line with what is seen today in large long standing black populations ever since 1870. Given this, there is no especially great level of racial inequality that we need to invoke racism to explain. The only kind of explanation that seems appropriate will point to things that black people in present day America, England, and Brazil, as well as the south of 1870, all share in common, and their degree of experience with racism is obviously not such a common factor. Obviously, we should not explain this inequality by pointing to a variable like racism which differs heavily between these locations and times despite the uniformity of inequality observed.
The only places where the ratio of black-to-white incomes are significantly higher is in nations where the black population consists mostly of voluntary immigrants. For instance, the ratio of black to white income is roughly .80 in Canada, .84 in France, and .77 in America when just looking at black immigrants. (CA; Algan et al., 2010; Pew, 2015; Anderson, 2013).
As we’ve already seen, the ratio is lower in Latin America. It is even lower in Africa. For instance, in South Africa, the ratio is 0.16 (Desilver, 2013). The reason that black immigrants tend to do relatively well is therefore not because they come from populations of black people who generally do well relative to whites. Rather, it is because, for the most part, only elite black people from Africa and Latin America have the ability to immigrate to Europe and North America. Of course, it is, by definition, also true that economically elite native black Americans do better relative to whites than is typical. The existence of these immigrant populations is thus no more evidence that fairly treated blacks will do better than is the fact that there are richer than average black people within every black population.
The fact that racial inequality has not lessened as racism has is thus another background reason to doubt common racism based explanations of past inequality and to require a very high bar of evidence be met prior to accepting them.
 Secondly, after controlling for obvious markers of loan risk the racial composition of an area only had an extremely weak relationship with the risk the HOLC assigned it (Greer, 2013).
 As we saw previously, in the modern day environment black people are more likely than white people to default on a loan even after controlling for variables like a credit score. Given this, we should require some further evidence before concluding that these maps assigned more risk to black areas than was justified. Moreover, on average red lined areas with lots of white people in them had better economic markers than did majority black redlined areas (Maas, 2021). So we have decent reasons to think that the maps were not unfairly racially biased.
We also have good reason to think that these maps didn’t matter much at least at the level of national racial inequality. First, the HOLC did not have a policy against giving out risky loans (Jackson, 1980). In fact, the limited data we have on who they gave loans to suggests that black people were disproportionately favored as loan recipients from the very beginning (Hiller, 2003). Certainly, by 1940 black home owners were over-represented among people getting loans through the HOLC (Michney et al., 2020).
As we saw previously, in the modern day environment black people are more likely than white people to default on a loan even after controlling for variables like a credit score. Given this, we should require some further evidence before concluding that these maps assigned more risk to black areas than was justified. Moreover, on average red lined areas with lots of white people in them had better economic markers than did majority black redlined areas (Maas, 2021). So we have decent reasons to think that the maps were not unfairly racially biased.
We also have good reason to think that these maps didn’t matter much at least at the level of national racial inequality. First, the HOLC did not have a policy against giving out risky loans (Jackson, 1980). In fact, the limited data we have on who they gave loans to suggests that black people were disproportionately favored as loan recipients from the very beginning (Hiller, 2003). Certainly, by 1940 black home owners were over-represented among people getting loans through the HOLC (Michney et al., 2020).
 Some people accuse the Federal Housing Administration (FHA) of using the HOLC maps, but this is just speculation as the maps the FHA used during this time period have been lost (Maas, 2021).
If is also often argued that racial inequality to get home loans was further exasperated by the GI bill. This bill was intended to give various benefits to veterans of WW2, but it has been argued that these benefits were denied to black vets. For instance, it is often said that the VA was less likely to back home loans for black vets.
For both the FHA and VA it is true that black people were underrepresented among people they gave loans to. (Michney et al., 2020).
Some people accuse the Federal Housing Administration (FHA) of using the HOLC maps, but this is just speculation as the maps the FHA used during this time period have been lost (Maas, 2021).
If is also often argued that racial inequality to get home loans was further exasperated by the GI bill. This bill was intended to give various benefits to veterans of WW2, but it has been argued that these benefits were denied to black vets. For instance, it is often said that the VA was less likely to back home loans for black vets.
For both the FHA and VA it is true that black people were underrepresented among people they gave loans to. (Michney et al., 2020).
 Unfortunately, I’ve not been able to find data with differentiates between these two organizations. It would be valuable to do so because economic concerns may explain the racial gap in FHA backed loans though this is a less plausible explanation for VA loans. Without more data, it is not possible to tell the degree to which this disparity was unfair.
Regardless, the above chart makes clear that the vast majority of white and black people who got home loans did not use the VA or the FHA. Moreover, we have good reason to think that nothing occurring between the mid 1930s and the mid 1940s increased racial inequality in access to home loans. First, the gap in property value between blacks and whites changed such that in 1940 the average black home was worth 35% what the average white home was and in 1960 it was worth 56% what the average white home was (Collins et al., 1999).
Unfortunately, I’ve not been able to find data with differentiates between these two organizations. It would be valuable to do so because economic concerns may explain the racial gap in FHA backed loans though this is a less plausible explanation for VA loans. Without more data, it is not possible to tell the degree to which this disparity was unfair.
Regardless, the above chart makes clear that the vast majority of white and black people who got home loans did not use the VA or the FHA. Moreover, we have good reason to think that nothing occurring between the mid 1930s and the mid 1940s increased racial inequality in access to home loans. First, the gap in property value between blacks and whites changed such that in 1940 the average black home was worth 35% what the average white home was and in 1960 it was worth 56% what the average white home was (Collins et al., 1999).
 We have data reaching further back for home ownership. We can see that not only did the racial gap narrow between 1930 and 1950 but that, moreover, the gap has stayed within a few points of 25 percentage points since 1910 (Collins et al., 2011).


 This fact was widely recognized at the time. And it is noteworthy that this was a race specific sort of equality. Poor white children were still going to far worse schools than the median white child, but major federal legislation combating this inequality was not enacted until the mid 1960s.
Having nearly achieved equality in school quality throughout the south, in Brown vs Board the supreme court ruled that the material equality of black and white schools was not sufficient to provide true equality because black children knowing that they could not go to the same schools as white children would cause them to notice they were considered inferior by society and this in turn would lower their self esteem. The court wrote “does segregation of children in public schools solely on the basis of race, even though the physical facilities and other “tangible” factors may be equal, deprive the children of the minority group of equal educational opportunities? We believe that it does… “the policy of separating the races is usually interpreted as denoting the inferiority of the negro group. A sense of inferiority affects the motivation of a child to learn. Segregation with the sanction of law, therefore, has a tendency to [retard] the educational and mental development of negro children and to deprive them of some of the benefits they would receive in a racial[ly] integrated school system.””
Notably, the evidence the court cited to support this opinion is not at all persuasive. The most famous concrete work of science they relied on was a study showing that black children in segregated schools thought white dolls were nicer and more likable than black dolls. This was true of children in segregated schools, but the very study the court cited showed that this was even more true of children in integrated schools (Clark, 1947).
This fact was widely recognized at the time. And it is noteworthy that this was a race specific sort of equality. Poor white children were still going to far worse schools than the median white child, but major federal legislation combating this inequality was not enacted until the mid 1960s.
Having nearly achieved equality in school quality throughout the south, in Brown vs Board the supreme court ruled that the material equality of black and white schools was not sufficient to provide true equality because black children knowing that they could not go to the same schools as white children would cause them to notice they were considered inferior by society and this in turn would lower their self esteem. The court wrote “does segregation of children in public schools solely on the basis of race, even though the physical facilities and other “tangible” factors may be equal, deprive the children of the minority group of equal educational opportunities? We believe that it does… “the policy of separating the races is usually interpreted as denoting the inferiority of the negro group. A sense of inferiority affects the motivation of a child to learn. Segregation with the sanction of law, therefore, has a tendency to [retard] the educational and mental development of negro children and to deprive them of some of the benefits they would receive in a racial[ly] integrated school system.””
Notably, the evidence the court cited to support this opinion is not at all persuasive. The most famous concrete work of science they relied on was a study showing that black children in segregated schools thought white dolls were nicer and more likable than black dolls. This was true of children in segregated schools, but the very study the court cited showed that this was even more true of children in integrated schools (Clark, 1947).
 The only sense in which the integrated school lessened this association for black children was by seemingly increasing the number of black children who more identified with white dolls than black dolls from 29% to 39% (table 4). And even this is a simple correlation for which there are many possible explanations (e.g. northern blacks were economically better off than southern blacks and may have been more white). Notably, today the “doll test” gives the same results as it did then (Young, 2008).
As noted previously, in the early 60s, prior to the time at which most southern states began to seriously desegregate their schools, black and white people had similar levels of self esteem. Since then, black self esteem relative to white self esteem has risen (Twenge et al., 2002). Given this, it is now clear that the “doll test” is not a valid measure of a group’s self esteem.
The only sense in which the integrated school lessened this association for black children was by seemingly increasing the number of black children who more identified with white dolls than black dolls from 29% to 39% (table 4). And even this is a simple correlation for which there are many possible explanations (e.g. northern blacks were economically better off than southern blacks and may have been more white). Notably, today the “doll test” gives the same results as it did then (Young, 2008).
As noted previously, in the early 60s, prior to the time at which most southern states began to seriously desegregate their schools, black and white people had similar levels of self esteem. Since then, black self esteem relative to white self esteem has risen (Twenge et al., 2002). Given this, it is now clear that the “doll test” is not a valid measure of a group’s self esteem.
 That said, despite a lack of empirical support, as the court noted the their view was the view of the majority of experts at that time (Max, 1948).
In terms of the effect that desegregation had, the first thing to say is that there are senses in which integration has and has not happened. In the 70s, schools became significantly less segregated than they had previously been (Wilson, 1982). The news sometimes reports that desegregation has not meaningfully occurred because for the last few decades the frequency with which minority children go to schools that have non-white super majorities has increased. This is true, but it is not due to white racial bias as is often implied. This trend has occurred because minorities used to make up something like 15% of school children and now they make up more than half. Accounting for this change in the underlying population size, we find integration levels have been stagnant or have modestly increased since the 1980s after significantly improving in the decade prior (Reardon et al., 2014; Fiel, 2013). Regardless, it is true that minorities still often go to schools where the students are nearly all minorities. In fact, the proportion of black students who attend the average white student’s school was less in 2005 than it was in 1970 (Reardon et al., 2014).
Given this, it is perhaps not surprising that the period in which integration occurred did not coincide with significantly increased equality in terms of income, crime, or net worth, etc. As we’ve already seen, there was no self esteem deficit among blacks to begin with and so of course this was not remedied either. It is true that racial gaps in educational attainment have lessened over the last 50 years or so, but these gains have not led to economic gains and so it is not clear that they’ve been of much value.
That said, despite a lack of empirical support, as the court noted the their view was the view of the majority of experts at that time (Max, 1948).
In terms of the effect that desegregation had, the first thing to say is that there are senses in which integration has and has not happened. In the 70s, schools became significantly less segregated than they had previously been (Wilson, 1982). The news sometimes reports that desegregation has not meaningfully occurred because for the last few decades the frequency with which minority children go to schools that have non-white super majorities has increased. This is true, but it is not due to white racial bias as is often implied. This trend has occurred because minorities used to make up something like 15% of school children and now they make up more than half. Accounting for this change in the underlying population size, we find integration levels have been stagnant or have modestly increased since the 1980s after significantly improving in the decade prior (Reardon et al., 2014; Fiel, 2013). Regardless, it is true that minorities still often go to schools where the students are nearly all minorities. In fact, the proportion of black students who attend the average white student’s school was less in 2005 than it was in 1970 (Reardon et al., 2014).
Given this, it is perhaps not surprising that the period in which integration occurred did not coincide with significantly increased equality in terms of income, crime, or net worth, etc. As we’ve already seen, there was no self esteem deficit among blacks to begin with and so of course this was not remedied either. It is true that racial gaps in educational attainment have lessened over the last 50 years or so, but these gains have not led to economic gains and so it is not clear that they’ve been of much value.
 Not all research purporting to show a contemporary effect of slavery utilizing regional variation makes this mistake. For instance, Reese et al. (2015) show that historical slavery rates predict modern levels of racial inequality in educational attainment after controlling for regional demographics. However, this is to be expected as it’s long been known that better educated blacks have historically been more likely than less educated blacks to move out of the south (Margo, 1988). Consequently, this sort of analysis is doomed from the start and cannot substantiate the claim that slavery has a lasting effect on racial inequality to this day.
To sum up this section on history, the best lines of evidence on red lining, the GI bill, school segregation, and slavery, suggest these historical events likely don’t have a significant impact on racial inequality today and, in some cases, probably didn’t even have a racially biased effect at the time. Given what we know generally about how racial inequality has persisted over time and the general lack of effect that parental economic success tends to have on their descendants, none of this should be surprising.
Not all research purporting to show a contemporary effect of slavery utilizing regional variation makes this mistake. For instance, Reese et al. (2015) show that historical slavery rates predict modern levels of racial inequality in educational attainment after controlling for regional demographics. However, this is to be expected as it’s long been known that better educated blacks have historically been more likely than less educated blacks to move out of the south (Margo, 1988). Consequently, this sort of analysis is doomed from the start and cannot substantiate the claim that slavery has a lasting effect on racial inequality to this day.
To sum up this section on history, the best lines of evidence on red lining, the GI bill, school segregation, and slavery, suggest these historical events likely don’t have a significant impact on racial inequality today and, in some cases, probably didn’t even have a racially biased effect at the time. Given what we know generally about how racial inequality has persisted over time and the general lack of effect that parental economic success tends to have on their descendants, none of this should be surprising.


Your rebuttal to “black applicants received 36% fewer call backs than white applicants” was confusing. It seemed like you were making the same point Ryan made in his old video “White Privileged: Employment Opportunity”, but you went too fast.
I think the best way to explain this is by giving an opposite example… suppose we could only apply for a basketball teams via a resume. A white guy and a black guy both write that they’re 6’2″ and have 4 years of highschool experience. Since their resumes are identical, should we assume that they’re equally skilled at basketball? Suppose that studies showed that controlling for height and highschool experience, blacks perform better at basketball… we’d expect basketball teams to choose the black applicant more often.
This phenomenon doesn’t mean that one group performs better than another on average… it’s possible that one group has higher average resume qualifications despite having the same average performance.
LikeLiked by 2 people
I actually understood his explanation like this: Since blacks get preferential treatment for things such as college/university admissions, it is easier for a black person to get a degree from a particular university than it is for a white person to do so. For instance, a 115 IQ black person (possible example: Michelle Obama) could realistically go to the Ivy Leagues whereas this is probably unlikely for a 115 IQ white person. So, it could make sense for companies to conclude that, statistically speaking, even when blacks and whites have equal qualifications, the black person might have been a beneficiary of affirmative action whereas the white person wasn’t. Of course, this is unfair to black people who genuinely would have still had the same qualifications even without affirmative action–which simply points out a way as to how affirmative action can harm extremely smart blacks who can survive in a meritocracy without too much problems.
LikeLike
Using Michelle Obama as a “possible example” of a 115 IQ is extremely dubious. She is NOT a smart woman, even for a negro. In fact, she, herself, admitted that she “never tested well” when asked about her grades, and how she was able to get into, so called, “prestigious universities”. Of course she never admitted that her skin color was the only reason she got in..
LikeLike
Shut the fuck up retard.
LikeLike
I like your analogy but you don’t need to get abstract to btfo “blacks aren’t called back for jobs” study. You can btfo it pleb-brained with ‘facts & logic.’
The study was conducted over three times, as to why the researchers through out their first two attempts the authors never explained (presumably it didn’t give them the results they wanted)
The authors of the study chose the black & white names by census data, choosing the most popular black & white names.
Black men had much more normal names like Maurice (a French name) as opposed to the most common black women names which included many more made up ebonic names. It’s been about ten years since I tore this study apart for a school project so double check the exact names but the black women included many made-up American black names, which are harder to pronounce and denote low status.
Black women and white women had a greater gap in call backs than black men vs white men.
HOWEVER many white names dramatically under performed in call backs. The authors did have the integrity to include the call back rate by name, and while ‘Sarahs’ received a very high call back rate ‘Emilys’ did not. On top of that black women with the name ‘Ebony’ outperformed many of the white women names.
If the discrimination was upon racial lines why was the black female name the literally means black (ebony!) the most called back???
Not all of the black female names were LeKeisha’s and Ebony’s, why would RACISTS chose the blackest sounding name over the bottom half of the most common white women names?
If the employers were racist against blacks it would seem like eliminating Ebony’s from your applicants stack would be the first place you’d start? No?
Why would Ebony’s applications be so favored over extremely white names like Emily & Becky, if the employers were discriminating against blacks?
All you have to do to btfo the discrimination in call back’s study is to pull up the names from the study and report their call back rate. It varies wildly between the names with ebony winning as the most called back black female name, beating out the bottom half of white names.
In other words the study is complete horse shit and by no means shows racial bias. And the authors never bothered to explain why they didn’t release the results of their first two attempts and why Ebony would be at the top of the list for black women call backs.
LikeLiked by 1 person
Amazing as always
LikeLiked by 1 person
Pingback: America’s Color Revolution – The American Sun
Do you address this study anywhere on your site? https://journals.plos.org/plosone/article?id=10.1371%2Fjournal.pone.0141854 It claims to find no relationship between violent crime rates and police shootings. I apologize if you have, I’m having trouble with the wordpress search feature
LikeLike
That paper is addressed in detail here:
https://ideasanddata.wordpress.com/2019/08/10/on-racial-bias-in-police-shootings/
LikeLiked by 1 person
“some white people may need to die so that Black people can get what they deserve.”
Ain’t that the truth. A *lot* of white people need to die, possibly millions, before the survivors realize that black people deserve free transportation back to Africa.
LikeLiked by 1 person
I rather you let the blacks stay and take all the whites back to Europe. I know that’s more expensive but just ask any native for their thoughts…
LikeLiked by 1 person
You might want that shaniqua, but that would just make north america another subsahara-africa lol.
Certainly not in your self-interest if you want to maintain a modern lifestyle instead of regressing to the medieval age.
LikeLike
So, should I be suspicious of the fact that you seem to be totally anonymous here? It just seems that someone who doesn’t stand by their convictions in public can’t really be trusted.
LikeLike
It could be because the people who blindly disagree with this article will flood him with hate and try to “cancel” him, go after his family and income and generally try to ruin life. It doesn’t matter how many facts and studies he uses SJW/idiots will throw tantrums because he hurt their delicate fee fees.
LikeLiked by 3 people
I am a Social Justice Warrior, and if you oppose my crusade for equality, I will doxx you out and destroy your life. You’ll lose your job, your professional licenses, your wife and kids, and all your friends.
If I cannot uncover your true identity, you’re an anonymous coward, an unemployed 40-year-old virgin micropenis living in your mother’s basement. Every story you tell is an anecdote you made up to support your racist, hateful right-wing ideas.
Heads I win, tails you lose.
LikeLiked by 2 people
Woah! Who the fuck are you? Why do you think you have the right to say that statistics are wrong? I listen to everything you have to say if I want to investigate with somebody else puts up I have that right. Threatening this author just makes you look like a racist afraid of white people…
d a v e🤣
LikeLiked by 1 person
What’s your name on kiwi farms? lmao
LikeLiked by 1 person
ummm maybe he doesnt want to dox himself ?
LikeLiked by 1 person
Pingback: America's Color Revolution - Read Right
Racist piece of shit.
LikeLike
Faggot SJW. Do statistics and facts hurt your delicate snowflake fee fees? Do you need a safe space and a consent hug?
LikeLiked by 3 people
Are you sure he able to read this?
LikeLike
Low IQ
LikeLike
Cool analysis to read. Everyone’s a victim: i could easily point out how annoying it is for all blacks to be blasted with ‘Differences in IQ across races’ studies – that their intelligence is ‘fixed’ and that they can’t do anything about it
LikeLike
White liberals are more enthusiastic about diversity than blacks or Hispanics. https://web.archive.org/web/20200624095654/https://pbs.twimg.com/media/EaQzriFWkAMZNXp?format=jpg&name=900×900
LikeLike
Source : https://www.vox.com/platform/amp/2019/3/22/18259865/great-awokening-white-liberals-race-polling-trump-2020?__twitter_impression=true )
The article above is very interesting to read. on racial issues, white liberals are more left than typical blacks
LikeLike
Eric Kaufmann: The leftward shift in racial ideology has been led by white liberals, not minorities (who tend to be more centrist). https://nytimes.com/2019/03/18/opinion/race-america-trump.html
“The country is not divided by racial conflict, but by conflict over racial ideology.”
LikeLike
“progressive activists are more likely to be rich, educated—and white. They are twice as likely as the average to make more than $100,000 a year and 3 times as likely to have a postgraduate degree…are the most racially homogeneous group in the country”
https://www.theatlantic.com/ideas/archive/2018/10/large-majorities-dislike-political-correctness/572581/
LikeLike
According to a new survey, 58% of “very liberal” Americans who expressed an opinion said the US should “remove the monument to four white male presidents at Mount Rushmore”. https://quillette.com/2020/06/22/toward-a-new-cultural-nationalism/
Self-hatred has always been a foundation of the radical left. It is enough to see the Marxist intellectuals hating the bourgeoisie when they themselves come from the bourgeoisie, the anti-imperialism of the radical left (which bizarrely criticizes imperialism only when it is American but has no problem with when it comes from the USSR or Russia today).
Many far-left intellectuals were of Jewish origin, but that did not stop them from being anti-Semites.
Many ecologists hate the human species which they see as responsible for all evils and as harmful to nature. (Environmentalists deify nature).
It is not for nothing that in Europe, we are witnessing an alliance between the left and the Islamists. Both are motivated by this same hatred for the West. That the Islamists hate the West I want to understand (even if it does not make sense to immigrate to Europe if you do not like Westerners) but that the left hates the West, I cannot explain it .
LikeLiked by 1 person
The perspective that dismisses criticism of Western influence as mere “hatred of the west” oversimplifies the complexities underlying global issues. The question of why individuals migrate from their home countries to the West cannot be adequately addressed without acknowledging the historical impact of imperialism and colonialism.
Imperialistic practices, resource exploitation, and support for corrupt regimes have left many nations in economic turmoil. When democratically elected leaders attempt to nationalize resources or establish independent currencies, they often face opposition by the west, are labeled “terrorists,” to justify coups or assassination attempts. This historical context highlights the systemic issues that drive people away from their homelands.
Furthermore, in Europe, there’s a need to explore the seemingly incongruent alignment of Muslims with leftist ideologies. Islamophobia, fueled by European supremacists, plays a role in fostering this alignment. By critically examining the broader geopolitical landscape, we can understand that some of today’s challenges stem from a history of imperialism.
The essay also suggests that the political spectrum is a false dichotomy. Both left and right, despite apparent differences, often serve the interests of powerful corporations. These entities prioritize financial gain over the well-being of individuals, undermining the ideals professed by both political extremes.
The demonization of Islam in the West is not solely rooted in concerns about terrorism; it also involves economic factors. Islam’s prohibition of usury conflicts with major industries in the West, such as gambling, drinking, pornography, and drugs. The refusal to acknowledge these economic disparities contributes to the failure of societies as leaders prioritize corporate interests over the genuine needs of their citizens.
Here are some books you can read to understand the current state of the world.
Imperialism and Colonialism:
“Imperialism: A Study” by J.A. Hobson
“Orientalism” by Edward Said
“A People’s History of the United States” by Howard Zinn
Resource Exploitation and Corruption:
“Confessions of an Economic Hitman” by John Perkins
“The Looting Machine: Warlords, Tycoons, Smugglers, and the Systematic Theft of Africa’s Wealth” by Tom Burgis
Islamophobia and Global Politics:
“Islamophobia: The Ideological Campaign Against Muslims” by Stephen Sheehi
“Who Speaks for Islam?: What a Billion Muslims Really Think” by John L. Esposito and Dalia Mogahed
Political Economy and Corporations:
“Capital in the Twenty-First Century” by Thomas Piketty
“Manufacturing Consent: The Political Economy of the Mass Media” by Edward S. Herman and Noam Chomsky
Usury and Economic Impact:
“Islamic Banking and Finance: What It Is and What It Could Be” by Tariq Alrifai
“Interest and the Islamic Economy: History and Policy” by Seif I. Tag el-Din
LikeLiked by 1 person
I can’t get a pdf of the winegard et. al paper from the link.
https://www.researchgate.net/publication/326144740_Low-status_groups_as_a_domain_of_liberal_bias
LikeLiked by 1 person
he has updated it, very nice
LikeLike
the subject of race is too often handled in cartoonish low resolution terms,often for bias confirmative ends.
the term race is rarely defined and often conflated with tribe , nation or culture .
when race is defined , often it’s by color which is more low resolution thinking when it should be by ETHNICITY , because Caucasian for example range from Nordic to Central Asian to Latino, same for blacks and Asians. all this conflation and generalization is nonconductive towards intelligent honest dialogue and serves to shut down free speech and drive people further into tribalism , a divide and conquer strategy of Marxism.
LikeLiked by 1 person
Pingback: The R-Word – Brave Ole World
Study shows that Libs support censorship when women, Islam or blacks are portrayed negatively.
But Libs have no prob when it comes to portraying men, Christianity or whites negatively.
Libs call it intersectionality… everyone else calls it hypocrisy. https://www.researchgate.net/publication/333677484_The_Ideology_of_Censorship
LikeLiked by 1 person
just wanted to let you know how useful this article has been
LikeLiked by 1 person
Pingback: The George Floyd Protest and Racial Bias Among Police | NEWS5
Huge meta-analysis finds (92 studies, 87,416 people) finds that changes in implicit associations does not predict actual racist behavior or explicit associations. In addition, they tested for publication bias and found an ant-hereditarian publication bias.
LikeLiked by 1 person
whoops forgot to actually post it:
https://psyarxiv.com/dv8tu/
LikeLike
Whites high on an anti-Hispanic modern racism-type measure favored Whites over Hispanics. But Whites low on the measure favored Hispanics over Whites.
https://www.ljzigerell.com/?p=7823
LikeLike
“For instance, a 2017 report on all the companies in the S&P 100 found over 90% of them had engaged in diversity initiatives and 75% of them had gone as far as setting specific hiring targets for minority employment. The same report found that such practices are rapidly gaining in popularity.”
The report you linked in the above paragraph has been deleted from that website and also not archived either on web archive, archive.today or Google Cache.
It was titled “Calvert Diversity Report 2017: Examining the Cracks in the Ceiling” and was saved as “28607.pdf” in the original website (https://global.eatonvance.com/includes/loadDocument.php?fn=28607.pdf&dt=fundPDFs).
Assuming you have it saved offline, can you post the pdf in some file sharing website like Google Drive or this: http://gofile.io/?
Thanks in advance.
LikeLike
In England, authorities deliberately let Pakistani Muslims rape tens of thousands of white girls in Rochdale, Rotherham, Telford,
Derby, Oxford, Newcastle, Halifax, Keighley and Huddersfiel for fear of stirring up racism.
Anti-racism is letting white girls be raped.
and the worst part is that the attackers were sentenced to ridiculous sentences. An attacker like Mubarek Ali spent 14 months in prison. Robinson, a far-right journalist who covered the scandal spent 13 months in jail for covering up the court’s confidentiality order by revealing details of the case. So a juvenile rapist spends almost as much time in prison as a journalist who notes the details of the case.
What all these gangs of rapists have in common is that they are mostly Pakistanis and Indians. And absolutely all the aggressors are Muslims. They rape these girls because they are non-Muslims.
These are white girls who come from popular backgrounds. The authorities have shown incredible contempt for them. They have deliberately closed their eyes so as not to penalize the Asian community (be careful in England, the term Asians mean Pakistanis, Bangladeshis and Indians. It is different from Asians in the United States who mainly refer to the people of East Asia as the Chinese or Korean).
Read this: https://en.m.wikipedia.org/wiki/Rotherham_child_sexual_exploitation_scandal
And: https://fr.m.wikipedia.org/wiki/Affaire_des_viols_collectifs_de_Telford
(Use Google translate, I put the French version because it is more complete than the English version.
France has a lot of flaws but at least the correct policy although very significant is less compared to England).
England combines what is worse: a completely delusional political correctness and a completely lax justice. At least in the USA, even if political correctness is delusional, justice is severe. if you commit rape, you are sent to prison for a very long time.
I even speak of the deep contempt that the English authorities have for poor whites. They go to university less than the minorities.
https://www.telegraph.co.uk/education/educationnews/11987142/Ethnic-minorities-more-likely-to-go-to-university-than-white-working-class-British-children.html
https://www.bbc.com/news/education-47227157
But the left will explain to you that being white is a privilege.
Read this:
https://www.dailymail.co.uk/news/article-8751131/White-working-class-children-UKs-deprived-pupils-MPs-warned.html
When you are a poor white man in England, not only are you poor but you do not get any special treatment unlike minorities. And those same minorities don’t give a damn if you’re a victim of minority violence.
If minorities target poor whites it is because they know they are defenseless
LikeLiked by 1 person
“And those same minorities don’t give a damn if you’re a victim of minority violence”
And those same authorities don’t give a fuck if you are a victim of violence from minorities.
LikeLiked by 1 person
In the UK, poor white boys are the least likely young people to go to college. Only 9% reach university level: https://web.archive.org/web/20201002074910/https://pbs.twimg.com/media/EjRghMXX0AIjrFB?format=jpg&name=900×900
LikeLike
Atrocious story of a UK teenage girl kidnapped by a Pakistani gang at age 15 and held in captivity as a sex slave for 12 years.
UK police refused to investigate for fear of racism charges.
https://www.dailymail.co.uk/news/article-6169489/Sarah-repeatedly-raped-twice-forced-marriage-EIGHT-abortions.html
LikeLike
Deliberate Allowance of Crimes: The assertion that authorities in England deliberately allowed crimes to occur is a serious accusation. It’s important to note that investigations into cases of child exploitation have revealed failures in handling these cases, but attributing these issues to deliberate actions to avoid stirring racism requires careful evidence and analysis.
Religious Motivation for Crimes: Linking the crimes solely to the religious background of the perpetrators oversimplifies a complex issue. Criminal behavior is multifaceted, and motivations can vary. It is incorrect to assert that all attackers are Muslims or that they commit crimes based on religious beliefs. Such generalizations can contribute to misunderstanding and bias.
Sentencing Disparities: The comparison between the sentences of a juvenile rapist and a journalist is presented without adequate context. Legal decisions are complex and depend on various factors, including the specifics of each case. A nuanced analysis is necessary before concluding that these sentences reflect a systemic issue.
Contempt for Poor Whites: The claim that English authorities have deep contempt for poor whites lacks substantial evidence. Socioeconomic disparities are complex, and attributing them solely to contempt from authorities oversimplifies the root causes of such issues.
University Admission Disparities: While the links provided discuss disparities in university admissions, the reasons behind these disparities are multifaceted and cannot be solely attributed to racial or ethnic factors. Socioeconomic status, educational opportunities, and other systemic factors contribute to these disparities.
Minority Violence: Asserting that minorities don’t care about violence against poor whites oversimplifies inter-community dynamics. It’s essential to avoid generalizations and recognize that individuals within any community may have diverse perspectives.
Engaging in nuanced, evidence-based discussions is crucial when addressing complex issues. Misinformation and broad generalizations can hinder meaningful dialogue and perpetuate stereotypes. It’s important to rely on verified information and encourage a more comprehensive understanding of the factors contributing to these challenges.
LikeLike
The Left is rewriting American history to portray whites as bad guys. The reality is more complex:
https://www.spectator.co.uk/article/the-myth-of-the-stolen-country/amp?__twitter_impression=true
LikeLiked by 1 person
“This page wasn’t found
Unfortunately, the page you were looking for at this address doesn’t seem to exist.
It could be that the link is incorrectly typed or out of date.” It seems your source doesn’t exist anymore, lol. Let’s address the point. The claim that “the Left is rewriting American history to portray whites as bad guys” is a broad statement and warrants a nuanced analysis. Let’s break it down:
Diversity of Perspectives in History:
Critique: Historical narratives have evolved over time to include more diverse perspectives, reflecting the experiences of marginalized communities that may have been previously neglected.
Consideration: A more inclusive approach to history seeks to present a well-rounded view of the past, acknowledging both positive and negative aspects of various groups’ actions.
Addressing systemic issues:
Critique: The claim implies a deliberate effort to portray whites negatively. In reality, many historical discussions focus on systemic issues, such as racism and inequality, to better understand their origins and impact.
Consideration: Recognizing historical injustices and their consequences doesn’t necessarily mean assigning blame to an entire racial or ethnic group. The goal may be to learn from the past and work towards a more just society.
Historical Revisionism:
Critique: The term “rewriting history” often implies a negative connotation of deliberate distortion. Historical scholarship evolves as new research emerges, challenging previously accepted narratives. This process is not inherently negative but rather a part of the academic pursuit of truth.
Consideration: Constant reevaluation of historical accounts is essential for a more accurate understanding of the past. It’s important to distinguish between evidence-based revisions and intentional distortions.
Promoting Critical Thinking:
Critique: Accusing the Left of solely rewriting history oversimplifies the complex nature of historical scholarship. Different individuals and groups contribute to historical discussions, and perspectives may vary.
Consideration: Encouraging critical thinking and multiple viewpoints in historical education allows for a more comprehensive understanding of the past. Constructive dialogue should be promoted to navigate differing interpretations.
In conclusion, discussions about the portrayal of history should be approached with an understanding of the complexities involved. While there may be ongoing debates about how to interpret historical events, it’s essential to consider the intention behind historical discussions and promote an inclusive and accurate representation of the past.
LikeLike
Evidence for publication bias in correspondence studies of ethnic discrimination in the supp materials of this paper. White dots indicate “missing studies” (which are concentrated toward the result of less or no discrimination). Authors are “surprised”
https://www.tandfonline.com/doi/abs/10.1080/1369183X.2015.1133279
LikeLike
1 fascinating study Klein quotes found that “priming white college students to think about the concept of white privilege led them to express more racial resentment in subsequent surveys.” Anti-racist indoctrination actually feeds racism—tribalism deepens https://nymag.com/intelligencer/2020/01/andrew-sullivan-america-needs-a-miracle.html
LikeLike
Reading white privilege does not make people more concerned about the plight of poor black people; it just makes them less concerned about the plight of poor whites. https://psycnet.apa.org/record/2019-22926-001
LikeLiked by 1 person
According to a Yale study, white liberals tend to dumb down their vocabulary when interacting with blacks, while white conservatives tend to not. The study speculates “well-meaning” white liberals hold “stereotypical” views of blacks. https://insights.som.yale.edu/insights/white-liberals-present-themselves-as-less-competent-in-interactions-with-african-americans
LikeLike
Thanks for this great article!
LikeLiked by 1 person
https://www.psychologytoday.com/us/blog/the-antisocial-psychologist/202102/are-liberals-really-more-egalitarian?amp&__twitter_impression=true
LikeLike
A very interesting book to read: https://www.amazon.com/White-Shaming-Prejudice-Virtue-signaling-Ignorance/dp/1792407858
LikeLike
The left uses education to teach hatred of whites: https://www.city-journal.org/the-miseducation-of-americas-elites
LikeLike
Pingback: Red Pills Left in the Bottle: Church, Reinventing Racism, and the Consequentialist Theory of “Privilege” – VrömStronbœn
This article brings up some interesting things:
https://freddiedeboer.substack.com/p/people-of-color-have-agency
The anti-racist left is in a way racist. By making whites the absolute evil and responsible for all the ills of blacks (and other racialized people), they completely infantilize these blacks. And in a way, it’s extremely pretentious and egotistical to say that it’s all about white people. To say that whites are responsible for all evil is to turn whites into some sort of superior race capable of totally controlling other races. The anti-racist left makes black victims incapable of acting on their own.
When you deny the moral responsibility of black criminals and claim that you have to accept what they do on the pretext that they are black. In the end you just insult other black people who respect the law.
LikeLike
In a psych experiment, participants were less likely to blame all Muslims for terrorism when they were asked if they blamed all white people for Dylan Roof. https://greatergood.berkeley.edu/article/item/how_we_can_fight_prejudice_against_muslims
LikeLike
Sean, your website is great but a small index at the top of your articles would aid in jumping to relevant info and navigating your pages.
LikeLike
Interestingly, Democrats are promoting affirmative action especially in schools and universities on the premise that POCs cannot feel comfortable with white teachers. But isn’t that literally racist by LW standards? What would a progressive say if a white person said, “I can’t feel comfortable because too many of my teachers are black”?
The Theory of Intersectionality elevates the insights, such as they are, of individuals with lower average IQ and less interest in logic. This isn’t JK Galbraith vs. WF Buckley anymore, this is now black women diversicrats talking about their lived experience of hair-touching.
So, our “intellectual” discourse is evermore based on the assumption that certain people (e.g., blacks, transgenders) are morally better than other people (whites, men, straights, etc).
Hence, the Good people deserve the money and prestige of the Bad people, who deserve pain.
Therefore, there are no longer any such thing as racist actions that members of any race could be guilty of, there are only racist people that only members of the white race can be guilty of. Moreover, whites deserve to be discriminated against because they are the Bad people.
The hypocrisy of anti-racists is obvious. They are interested in fighting only certain racisms. They have no problem with anti-white racism.
I even see a change in anti-Semitism. (In Europe, the left has long had a problem with anti-Semitism. Except when it helps to fight the far right. They will fight against anti-Semitism when it comes from evil white extremists. right. But when it is Muslims who attack the Jews, they are silent).
In the US, due to the influence of Jews in the Democratic Party, the left has tended to be more against anti-Semitism. But that is about to change. This is especially true for the left wing of the Democratic Party (which is extremely complacent with anti-Semitism).
(Just look at what happened in 2021 during the conflict between Israel and Hamas. The same people (AOC, Omar, … ° who claim racist to talk about ALL Lives Matters have produced statements to say that ‘they condemned anti-Semitism and Islamophobia “. While there was no Islamophobic incident during this period, only anti-Semitic incidents. In short, condemn Islamophobia when the only incidents recorded are anti-Semitic attacks made by Muslims: this sounds like the minimization of anti-Semitism)
How can you be against anti-Semitism and in favor of Islam ??? The majority of Muslims in this world are anti-Semites. https://www.pewresearch.org/global/2010/02/04/chapter-3-views-of-religious-groups/?utm_source=pocket_mylist
You just have to see what is happening in Europe. Because of Muslim immigration, Jews are in danger. They cannot live in cities where there are a lot of Muslims. The Seine Saint Denis in France was cleansed of Jews because this place has a large Muslim community. In short, I do not see how you can at the same time be favorable to Islam and be against anti-Semitism. There comes a time when you have to choose between Muslims (especially if they’re Arabs) and Jews. The European left has long chosen to prefer Muslim Arabs to Jews. In the US, the problem is less severe. There are fewer Muslims. And these are immigrants strongly selected to be the elite of their countries (they are more educated and more secular. So probably less anti-Semitic than normal Muslims). Still, clearly you can see that the problem is happening.
Just look at what happened with the anti-Asian attacks in the US. On the one hand, the left wants to fight against anti-Asian racism, but on the other hand, the left doesn’t want to acknowledge the fact that these attacks are overwhelmingly from blacks. They talk about fighting the epidemic of anti-Asian racist assaults without ever pointing out that 95% of these assaults come from black people. In other words, they will never solve the problem. How do you solve the problem of assaults if you don’t admit that the assaults are coming from black people? In the US, there is a rule: when the media reports on a racist incident without mentioning the ethnicity of the person who committed the racist incident, it is almost certain that this person is a non-white and a POC. On the other hand, if a white person commits a racist act, the media will always specify that they are white.
This reminds me of the European left that wants to fight against street harassment but does not want to recognize that this harassment is done by African or Arab immigrants. They just blame the patriarchal society.
Some anti-racists have claimed that anti-Asian assaults are the work of white supremacy even if the assailants are black. This shows how white supremacy has become the ultimate evil of the American left. The left lends white supremacy magical powers. For leftists, white supremacy is responsible for all evil.
LikeLike
In short, the fight against racism according to anti-racists is really more a form of tribalism to benefit certain groups over others. In the US, the black ethnic group is sacred to anti-racists. Any form of action against blacks is considered racist in the US by the left. Then it’s Latinos. And finally, Asians. There is clearly a hierarchy of ethnicities. Whites being the absolute evil, blacks the absolute good. If there is an Asian/black conflict (as in the case of affirmative action), anti-racists will always prefer blacks to Asians. Very often, if you look at anti-racists, you see that what they condemn as racist would not be a problem in a situation where it involved another ethnic group.
Anti-racism has a conflicting view of ethnic group relations. The goal is to empower some groups over others. The goal of the left is never to fight oppression but to reverse it. They want white people to be discriminated against and oppressed just like men or heterosexuals.
Anti-racism has a conflicting view of ethnic group relations. The goal is to empower some groups over others. The left’s goal of fighting oppression is not to end it but to reverse it. Let those who were the oppressors become the oppressed. They want white people to be discriminated against and oppressed like men or heterosexuals.
Anti-racism varies by ethnicity. It depends on both the ethnicity of the victim and the ethnicity of the perpetrator. For example, a white person will never be a victim of racism according to anti-racists. On the other hand, an Asian person will be a victim of racism, but will be more likely to be recognized as a victim of racism if the perpetrator is white than black. Anti-racists are much more reluctant to recognize racism if it comes from a black person. Of course, if the black person is conservative, that person will be less protected from charges of racism.
In general, when it becomes impossible to deny a racist act by a black person, anti-racists will condemn the racist act but will go out of their way to avoid specifying the ethnicity of the perpetrator.
LikeLike
Anti-racists assume that white people are racist simply because they are white. If that’s not a racist presupposition, I don’t know what is.
Antiracists talk about fighting racist stereotypes, but the funny thing is that what they consider racist stereotypes is anything that goes against their ideological worldview. Basically, fighting against racist stereotypes is like accepting the ideology of anti-racists (of course, they never bring any evidence to justify their claims. They want people to accept what they say uncritically). Oddly enough, the people who fight against racist stereotypes seem to have many ideological stereotypes (and don’t seem to see the problem with having such stereotypes).
Let’s just say that their worldview is based on a lot of assumptions that seem rather dubious.
LikeLike
I think leftists are genuinely miserable people at heart. They struggle with constant disappointment that the world doesn’t live up to their ideal standards. This makes them bitter, angry, and unable to experience joy unless it comes at the expense of those they oppose.
Facebook’s algorithm was problematic because it treated expressions of hatred for whites and men same as for other groups. It therefore had a “disparate impact” against minorities, which it should’ve revealed to “civil rights leaders.” https://www.washingtonpost.com/technology/2021/11/21/facebook-algorithm-biased-race/
Facebook rejected a plan to treat speech directed against people who were “Black, Jewish, LGBTQ, Muslim or of multiple races” more harshly, another sign of their “racism.” They finally agreed though to stop automatically taking down criticisms of whites, Americans and men.
WASHINGTON POST: Facebook’s Algorithms Found That Most Hate Speech On Facebook Was Anti-White And/or Anti-Male, But That’s GOOD Hate Speech. The Washington Post article shows how deeply racist anti-racists are.
LikeLike
It’s weird that BLM guys only get upset about the death of blacks when they are killed by whites or cops (even when, by the way, it’s self-defense and the black is the aggressor). The vast majority of murders of blacks are committed by blacks but the anti-racists don’t care because they want to spit on the police and on whites.
What evidence is there that the police officer who killed Floyd was racist? None. Yet they assumed he was a racist simply because he was a white police officer. This illustrates their own racism. If you assume someone is racist simply because of their skin color you are racist.
LikeLike
America is a land where teachers are on the hunt for blond students to punish to get their numbers up. Where the gov might notice you didn’t punish all races equally, so your small school district has to be buried in tens of thousands of pages of paperwork
Click to access SSRN-id3104221.pdf
LikeLike
Reblogged this on Calculus of Decay and commented:
From 2020- amplified even more today
LikeLike
cracker
LikeLike