When discussing why it is that black people are poorer than white people, one variable that is often brought up is educational opportunity. It is alleged that Black Americans have less in the way of educational opportunity than do whites and that this is an important part of the explanation for why it is that Black Americans are, on average, poorer than white Americans.
Racial differences in educational outcomes certainly are real. For instance, Asian Americans complete more years of schooling, on average, than do whites, and whites complete more yeas of schooling than do black and Hispanic Americans.

We see the same pattern when we look at data on GPA by race.

Department of Education (2014)
In fact, the difference in grades between black and white people is significantly greater than is the difference between poor and non-poor people.

With respect to SAT scores, Black Students with household incomes of over $100,000 score below white students with family incomes between $20,000 and $25,000.

Seeing all this, some people assume that black students must have lower quality schools, and this must explain their poor academic performance.
Per Pupil Spending
It is often alleged that black schools receive less funding than white schools. Before looking at this issue directly, it’s worth briefly reviewing the literature on whether or not educational spending matters.
Lafortune et al. (2015) analyzed the impact on test scores of 68 changes to school spending that took place at the state level between between 1990 and 2013. They estimate that a $500 increase in spending led to a .09 SD increase in test scores.
Jackson et al. (2018) look at how variation in school funding caused by the Great Recession impacted student performance. They estimate that a 10% reduction in spending led to a .078 SD reduction in test scores and a 2.6% decrease in graduation rates.
Miller (2018) analyzed data on changes in school funding due to changes in property valuation across 24 states. On this basis, Miller estimates that a 10% increase in spending leads to a .05 to .09 SD increase in test scores and a 2.1% to 4.4% increase in graduation rates.
Jackson et al. (2015) analyzed changes to school spending and estimated the following relationships: “a 10 percent increase in per-pupil spending each year for all twelve years of public school leads to 0.27 more completed years of education, 7.25 percent higher wages, and a 3.67 percentage-point reduction in the annual incidence of adult poverty; effects are much more pronounced for children from low-income families.”
Thus, several analyses utilizing different data sets suggest that school spending has a moderate effect on test scores and future life outcomes.
Turning to race, to establish that black students have fewer resources dedicated to their education, liberals often cite research showing that whiter school districts are better funded:
What is ignored in such analyses is the fact that, within school districts, money is disproportionately given to blacker schools. This was the finding of Ejdemyr and Schores (2017) who concluded that “we find that poor and minority students on average receive 1 to 2 percent more resources than non-poor and white students in the same district”.
Because whiter districts get more funding but whiter schools get less funding within a given district, these sorts of statistics cannot be used to derive per pupil spending. To do that, we have to look at school level analyses.
Murray and Rueben (2008) calculated spending per pupil for US schools between the years 1972 and 2002. They found the following: “In 1972, the ratio of nonwhite to white spending was .98; this trend had reversed by 1982, as spending per pupil for nonwhite students was slightly higher than for white students in most states and in the United States as a whole and has been for the past 20 years”
Thus, since 1982, spending on non-white students has been greater than spending on white students.
This issue was revisited by Richwine (2011) who found that spending on black students was 1% greater than spending on white students, while spending on Asian and Hispanic students were a few percentage points lower.
By and large, leftists ignore attempts to accurately calculate school funding by race. An exception to this was provided by a 2011 report from the Center for American Progress. The authors wrote a response to Richwine in which they analyzed three years worth of data and broke their results down by state.

Their analysis confirms Richwine’s findings, but is interpreted in a truly bizarre fashion. They write “But racial disparities in education spending clearly exist in a host of other states. In Illinois, New York, and Pennsylvania, per pupil expenditures for black and Hispanic students hover around 90 percent of those for white students. This finding is a reflection of these states’ regressive funding tendencies, and the fact that people of color tend to be more concentrated in high-poverty districts. The flip side of this disturbing evidence comes from states such as Massachusetts and New Jersey in which high-poverty districts receive greater support from state and local sources than low-poverty districts.”
Seemingly, the authors found it note worthy that Richwine’s average static was … an average. They express dismay at the fact that, in some states, black children receive 10% less funding than white children, but seem relived that in others black children receive as much as 18% more funding than white children. Their language seems to imply a sort of anti-white bias on the part of the authors. In any case, if we are trying to explain why, on average, African American life outcomes differ from white life outcomes, and we are talking about national populations, then average spending per pupil across the nation is obviously the correct statistic to look at.
Thus, spending doesn’t seem to systematically favor white people and, relative to black people, there is actually a slight anti-white bias in funding.
Class Size
Turning to class size, Glass and Smith (1979) analyzed 77 previous papers on the relationship between class size and achievement scores, finding that students in small classes do significantly better when the classes a quite small, but that differences in class size past around 20 students per teacher didn’t make much of a difference.

More recently, Hattie (2005) aggregated data from 1,165 effect sizes and produced a meta-analytic effect of .13. Of course, these studies are largely cross sectional in nature and so don’t permit causal inference.
Slavin et al. (1989) meta-analyzed 8 studies that either utilized random assignment or controlled for pre-existing differences in school achievement. The median effect in this data set was also .13, lending credence to the cross sectional research.
Since then, several states have undergone programs to reduce class size, and they seem to have improved student performance.
For instance, Krueger (1999) analyzed the effects of class characteristics on student achievement when students were randomly assigned to classes via Tennessee’s Project STAR. Class size had a significant effect such that being assigned to a class with fewer than 17 students predicted a .22 SD increase in scores.

Nye (1999) found that gains from the STAR program were still evident in a five year follow up.

Similarly, Molnar et al. (1999) report on Wisconsin’s SAGE program, a 5 year project which reduced class sizes in Wisconsin to 15 students per teacher. Molnar et al estimate that the program improved test scores by around .20 SD.
On the other hand, as reported in Ehrenberg et al. (2001), in 1996 California reduced its school classes sizes from an average of 29 maximum of 20. This reduction is estimated to have increases scores by .05 to .10 SD. This is a smaller effect, but that is to be expected given the non-linear relationship between class size and student performance. In an case, the data here is of weaker quality than in other studies because students were not properly tested prior to the intervention.
So it seems like class size has an effect. Turning to race, we see that racial differences in class size were non-existent by the early 1970s.

In fact, even in he segregated south racial class size differences differences were probably too small to matter by the late 1940’s.

Thus, racial differences in class size are not a plausible cause of recent racial differences in academic performance.
Teacher Quality
Turning now to teacher quality, there is great deal of controversy about the degree to which commonly measured teacher characteristics matter. In regressions with lots of controls, teacher characteristics don’t seem to predict future income much at all.

However, these sorts of regressions are controversial because usually control for educational attainment, and school quality may impact wages indirectly by impacting college attendance. Strayer et al (2002) looked at the relationship between school quality, earnings, and college choice, in the NLSY. Concerning the proportion of teacher’s at a high-school with graduate degrees, they found that a 5.75 point increase in the proportion of highly educated teachers predicted a 1 point increase in college attendance and a .25 point increase in an individual’s wages.
Without going further into this area, let’s assume, for the sake of argument, that commonly measured teacher characteristics impact future income. Well, on average, blacker schools have more experienced teachers with more formal education and more pay.

Even in the segregated south, black and white teacher pay equalized in the 1950’s.

Thus, teacher quality, at least as measured by commonly reported characteristics, is unlikely to explain racial differences in school performance.
Class Offerings
Another dimension of school quality consists of the courses offered by the school. Sometimes, it is pointed out that African Americans have, on average, fewer classes offered to them than do white Americans.
For instance, 71% of white Americans, 70% of Asian Americans, and 67% of Hispanic Americans attend high-schools that offer algebra one and two, geometry, calculus, biology, chemistry, and physics. By contrast, this set of courses is only available for 57% of African Americans.

It is possible that these difference impact income. Empirical estimates suggest that taking a set of advanced classes in high-school might increase an individuals income in adulthood by as much as 7% (Rose et al,. 2004). However, I’ve been unable to find studies account for the possibility that the traits which allow someone to do well in advanced classes, intelligence and self discipline, lead to higher income, and thus create a misleading correlation between taking advanced classes and future income.
In any case, for this to be a meaningful difference in educational opportunity we must assume that African Americans who would otherwise succeed in advanced classes are not being offered such classes. There is a 14 point gap between blacks and whites in the probability that they will attend a high-school that offers the full possible set of STEM courses but this does not mean that there is a 14 point gap among blacks and whites who are able to succeed in such classes.
Looking at data on AP sheds some light on this question. There doesn’t seem to be much of a relationship between how black a school is and the probability of it offering AP courses. Since the 90s, the schools least likely to offer AP courses have actually been the whitest schools there are.

I’ve been unable to locate more recent national data, but several state-level analyses support this conclusion. For instance, in Florida, Black and Hispanic students are roughly as likely as White students to attend a high-school offering AP courses for Math, Science, English, or Social Studies.

The same seems to be true of Texas:

In California, there seem to be only minuscule black-white differences in the AP course offerings, though there are more substantial differences for Hispanics. 

On the whole then, there doesn’t seem to be good reason to think that Black people are have less opportunities to take AP classes.
Now, Black people account for roughly 9% of those who take an AP classes, but only 4% of those who pass an AP exam.

In fact, among blacks who take an AP test, only 26% receive a qualifying score.
To pass an AP test, you must score a 3 or higher. For whites who take the test, the mean score is 2.97. This suggests that roughly the right number of whites are taking AP courses because restricting the set of whites who take these tests to a more elite subset would raise the mean score above 3, meaning that qualified people wouldn’t be taking the tests. By contrast, the Black mean score is 1.91. This suggests that the set of black students who are capable of passing these tests is probably smaller than the set of black students currently attempting them.

So, returning non-AP class offerings, the following seems likely to be true: if every person who is able to complete all the STEM classes attends a high-school in which they are offered, black people will be less likely than white people to attend a high-school offering this set of classes since a smaller proportion of black people are able to pass them.
I can’t say exactly how large this gap will be, but I suspect it would be large. Consider the AP Calculus AB class, a rough equivalent of calculus 1 in college. On average, white students pass this class, while only 28% of black students do. Given this, it would seem entirely appropriate if white students were far more likely than black students to attend schools that offer calculus.
This is at least a partial explanation for racial gaps in class offerings. I don’t know that it is the only explanation that matters, but it is hard to think of what else could be going on. It doesn’t seem plausible that black schools having tons of students who are able and willing to take calculus classes and the schools simply refuse to offer such classes anyhow because the students are black. And it isn’t as if black schools lack teachers with the formal education needed to teach such classes. Again, black schools have more educated teachers than white schools.
At the very least, I think we can say that there isn’t good evidence showing unfair racial differences in class offerings. By contrast, there is good evidence suggesting that racial differences in class offerings are at least partially fair. Given this, and the fact that class offerings have not been shown to causally impact income, and the fact that racial differences in class offers are only moderate in size, the impact that unfair racial differences in class offers have on racial differences in income is probably very small.
Student Quality
One plausible determinant of an individual’s educational opportunity is the quality of their peers. In this respect, I do think schools with a greater proportion of black students are at a disadvantage, because, on average, black students are lower quality students than white students.
This is not to say that there are not bad white students, or that most black students are not good students. Instead, it is merely to say that there is an average difference such that the proportion of bad students is higher among African Americans even if that is a minority of all groups.
The evidence for this is fairly overwhelming. Most obviously, this is suggested by grades and SAT scores. It is also evidenced by the amount of time students spend on homework. Black and Hispanic students spend the less time on homework than whites, and whites spend less time than Asians. This is true despite the fact that black and Hispanic students are more likely than whites and Asians to have parents who check to see that their homework is completed.

Given racial differences in GPA scores, it shouldn’t be surprising that races differ in other measures of scholastic aptitude But there is also strong relationship between how non-white a school is and how much violence goes on in the school.

At the individual level, this is reflected in racial differences with respect to school punishments. As the LA Times reports “The Civil Rights Data Collection, a national survey conducted by the U.S. Department of Education, gathered information on more than 50 million students at more than 95,000 schools… The survey included 1,439,188 preschool students in 28,783 schools… black preschool children overall were 3.6 times as likely to be suspended as white preschoolers.”
Other research shows that racial gaps in suspension rates persist as kids grow older and remain even after controlling for socio-economic status (Skiba, 2002).
However, these racial differences do not persist when comparing people with the same previous histories of behavioral problems, or when comparing people who were both sent to the principals office for the same offense (Wright et al., 2014; Macdonald, 2014). These findings suggest that racial differences in suspension and expulsion rates are due to differences in behavior rather than bias in rule enforcement.
Given this data, it should be unsurprising that there are also racial differences in bullying behavior. Farris (2006) defines outdegree bullying as the number of other students each student bullied in the past three months and indegree bullying as the number of other students who picked on each student. Farris finds that Black students are more likely to be bullies than are Whites students while White students are more likely than black students to be the victims of bullying. Latino students are more likely than black students to be engage in, and be a victim of, bullying.

Farris also finds that racial differences in family SES, neighborhood SES, attachment to friends, parents, and school, and physical development, don’t explain racial differences in bullying.

With respect to interracial bullying, Farris finds that Black on White bullying is 64% more common than is White on Black bullying.

In part, these differences probably arise because buying is socially rewarded in non-white student subcultures. After controlling for gender, age, academic performance, family structure, parental educational attainment, and extracurricular actives, Farris find that the more non-white students bully others, the more popular they are among their peers. This effect does not exist among white students.

So, with respect to in-class behavior, bullying behavior, scholastic achievement, and study habits, black and Hispanic students seems to under-perform white and Asian students. Given this, it should be unsurprising that attending a school with more minority students predicts various negative student outcome.
Perhaps most dramatically, Farris finds the following: “Regardless of race, attending a high-minority school increases risk of suicide significantly: for every one percentage point increase in the percent minority in the school, the likelihood of suicide increases by one percent.”
Similarly, Hanish and Guerra (2000) analyzed data on bullying among 1956 children employing a longitudinal design over a two year period. They found that “White children attending predominantly non-White schools were at greater risk of being victimized than those attending predominantly White schools (b = .44). In contrast, African-American children were slightly more likely to be victimized in predominantly African-American schools than in predominantly non African-American schools (b=.14, p .05). For Hispanic children, risk of being victimized was fairly constant across the range of school ethnic compositions (b= .11, p =.12).” Controlling for poverty did not alter this finding.
We see a similar relationship with scholastic performance. For instance, Bohrnstedt (2015) finds that the both Black and White students score worse on standardized tests the greater the proportion of their school that is Black. This effect was more pronounced for Black males, with their scores dropping the most as the black-ness of schools increased. Even after controlling for socioeconomic status, going to a blacker school continued to negatively predict performance among black students although it did not predict worse performance among white student.

Goldhaber et al. (1999) analyzed data on roughly 18,000 students, and found a more complex relationship between racial demographics and student performance. There was a negative relationship between a student’s math scores and the proportion of their school that was white. That is, students going to whiter schools did worse. However, there was an even stronger negative relationship between a student’s math scores and the proportion of their math class that was non-white. So, the ideal scenario according to this model would be to go to a school that wasn’t all that white, but then go to a class that was completely white. These effects remained after controlling for the student’s family income and parental education, their race and sex, the region of the country they lived in, the school size, their class size, and their teacher’s degree of experience and formal education. Given what was covered previously, this school-level may be due to whiter schools being slightly less well funded than blacker schools while the class-level effect may be due to the culture and peer level variables that I’ve just covered.
School diversity even predicts negative outcomes with respect to student-rated school satisfaction, Consider the evidence from Rothman, Lipset, and Nevitte (2003). This paper analyzed the relationship between racial diversity and the experiences people had at school in a sample drawn from 140 American universities (N = 4,083 individuals, 1,643 students, 1632 faculty members, 808 administrators). They found the following:
“As the proportion of black students rose, student satisfaction with their university experience dropped, as did their assessments of the quality of their education and the work ethic of their peers. In addition, the higher the enrollment diversity, the more likely students were to say that they personally experienced discrimination… Faculty members also rated students as less hard-working as diversity increased…
Enrollment diversity was positively related to students’ experience of unfair treatment, even after the effects of all other variables were controlled. (As the proportion of black students grew, the incidence of these personal grievances increased among whites. Among blacks, however, there was no significant correlation. Thus diversity appears to increase complaints of unfair treatment among white students without reducing them among black students.)”.
These perceptions of discrimination were not shared by the non-student sample. The authors write:
“Among faculty and administrators, higher minority enrollment was significantly associated with perceptions of less campus discrimination and, among administrators, more positive treatment of minority students. But these findings were offset by the absence of similar results among students, who reported more personal victimization as diversity increased.”
It’s also worth noting that increases in the proportion of a school that was Asian American increased student satisfaction with the school and all these results contained to be true after controlling for various measures of socio-economic status.
Thus, student quality seems to be a measure on which black schools are genuinely worse than white schools. While not the fault of white people, this situation is, in a sense, genuinely unfair for black students of high student quality.
Bias at Universities
We’ve seen that there is a slight pro-black bias in terms of overall spending, class size, and teacher quality. There may be a pro-white bias in terms of class offerings, but there is no evidence showing that this is so, and even if there is it cannot account for more than a tiny proportion of racial income differences. On net, it seems that there is a pro-black bias in American high-schools.
The same is true in our university system, and this is easier to show. Once qualifications are controlled for, black applicants are roughly 20 times more likely than white applicants to be admitted to a university, law school, or medical school. Hispanic Americans are three times as likely to gain admittance.

With respect to Asian Americans, there is a 6% bias against them using the median result of the above analysis and a 59% bias in favor of them using the average result. Recent news about Harvard university has spread the idea that elite institutions discriminate heavily against Asian Americans, but this does not seem to generally be true.
In selective colleges, it’s been estimated that the proportion of students who are white would increase from 66% to 75% if admissions were based solely on test scores.
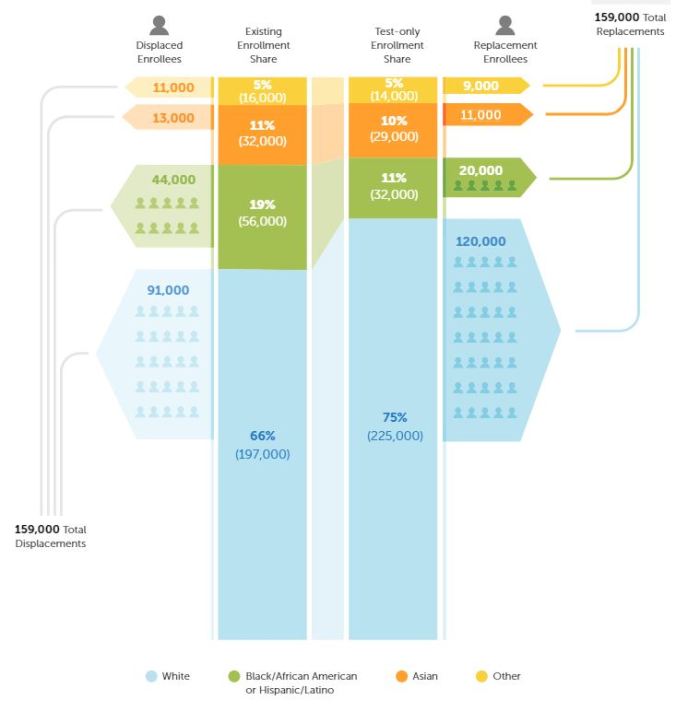
It is noteworthy that the proportion of Asian students would actually decrease in such a scenario, suggesting once again that the Harvard case is not representative of American elite institutions.
Once in college, minority students are more likely to receive aid in paying for their education. These differences are real, but not large. Minority students account for 38% of the student population and 40.4% of grant funding. White students account for 61.8% of all students and 59.3% of grant funding.

Again, it’s worth noting that there is a slight pro-Asian bias in the above data.
There is also a slight trend such that white students are more likely than black students to be employed while in college. Asian students are less likely than white and black students to be employed.

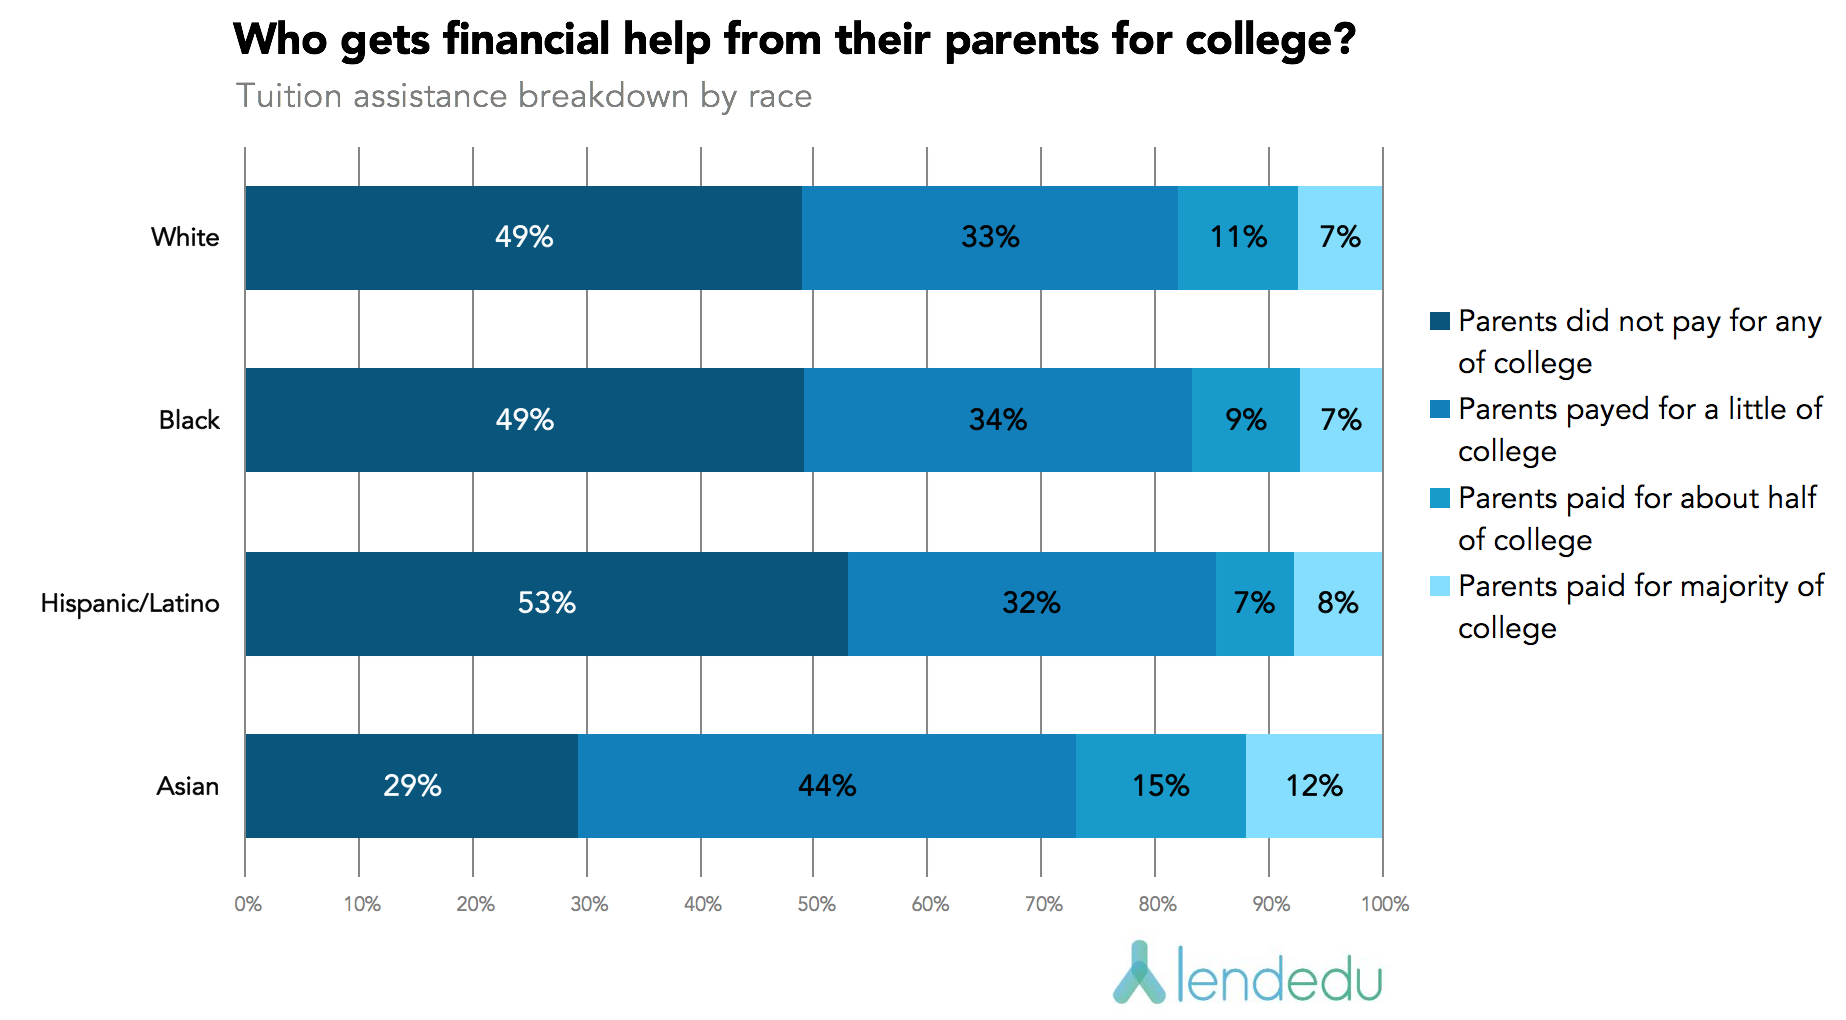
Black, Hispanic, and white students have similar chances of their parents paying for a significant proportion of their college education. Asians are more likely than others to have parental aid.
Thus, there is a strong anti-white bias in college admissions and a slight anti-white bias in college funding. The media has recently suggested that there are systematic anti-Asian biases in our university system, but that seems probably wrong.
Conclusion
At the beginning of the article I noted that black Americans have lower educational attainment than white Americans. This is true, but if you only look at Americans with IQ scores equal to or greater than the average IQ score of college graduates, we see that Black Americans have higher educational attainment than white Americans do.

This is exactly what we would expect if the education system actually exhibited a pro black bias. So, if anything, racial gaps in earnings would be larger if educational opportunity were equalized across races.

Reblogged this on Muunyayo.
LikeLike
Pingback: How Racist are White Americans? | Ideas and Data
Pingback: Race Differences in Aggression – g-loaded
“ This is exactly what we would expect if the education system actually exhibited a pro black bias. So, if anything, racial gaps in earnings would be larger if educational opportunity were equalized across races.”
Excellent. And these black college-graduates/low-earners are mired in student loans and are moaning that the high-earning/no-college whites don’t pay enough taxes.
LikeLike
Pingback: Race Differences in Aggression – Race & Conflicts
There is clear evidence that black college students tend to be bad students: https://www.rt.com/op-ed/518163-georgetown-academics-cancelled-zoom/
an interesting graph to watch:
https://web.archive.org/web/20210321165413/https://pbs.twimg.com/media/Ew0lSVtUcAI20N7?format=jpg
LikeLike
Pingback: Vaush: Ultimate Research Document 2.0 | Race & Conflicts